Cities with the Highest Percentage of Danish Population in Massachusetts
RELATED REPORTS & OPTIONS
Danish
Massachusetts
Compare Cities
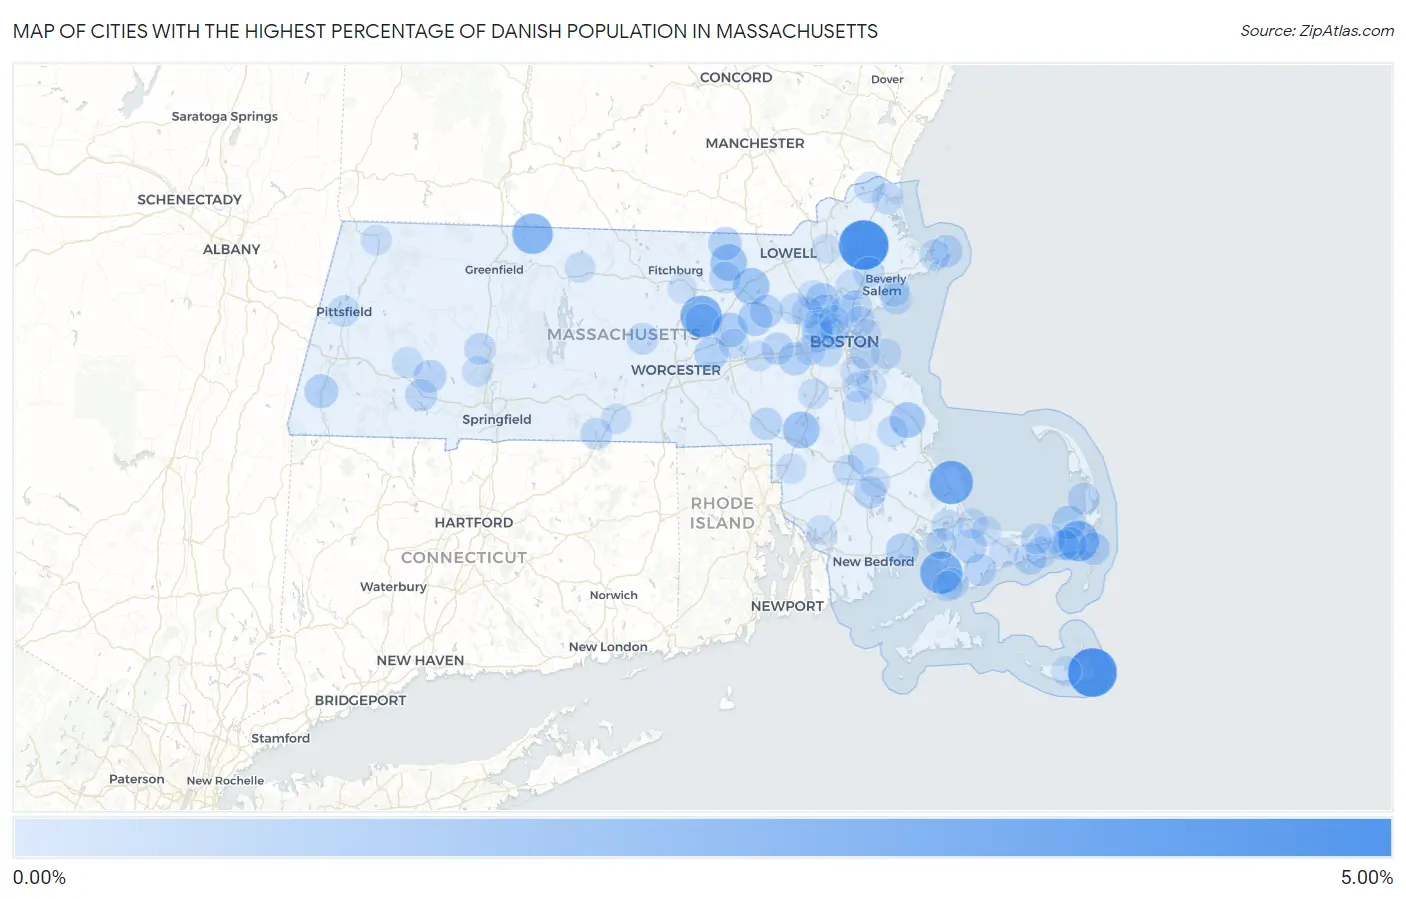
Map of Cities with the Highest Percentage of Danish Population in Massachusetts
0.00%
5.00%
Cities with the Highest Percentage of Danish Population in Massachusetts
| City | Danish | vs State | vs National | |
| 1. | Boxford | 4.53% | 0.21%(+4.33)#1 | 0.36%(+4.17)#652 |
| 2. | Siasconset | 4.35% | 0.21%(+4.14)#2 | 0.36%(+3.99)#681 |
| 3. | The Pinehills | 3.10% | 0.21%(+2.90)#3 | 0.36%(+2.74)#1,085 |
| 4. | West Falmouth | 2.84% | 0.21%(+2.64)#4 | 0.36%(+2.49)#1,196 |
| 5. | South Lancaster | 2.68% | 0.21%(+2.47)#5 | 0.36%(+2.32)#1,277 |
| 6. | Cedar Crest | 2.52% | 0.21%(+2.31)#6 | 0.36%(+2.16)#1,371 |
| 7. | East Harwich | 2.44% | 0.21%(+2.24)#7 | 0.36%(+2.08)#1,420 |
| 8. | Northfield | 2.42% | 0.21%(+2.22)#8 | 0.36%(+2.07)#1,434 |
| 9. | Foxborough | 1.60% | 0.21%(+1.39)#9 | 0.36%(+1.24)#2,216 |
| 10. | Groton | 1.56% | 0.21%(+1.36)#10 | 0.36%(+1.21)#2,273 |
| 11. | Littleton Common | 1.53% | 0.21%(+1.33)#11 | 0.36%(+1.18)#2,329 |
| 12. | North Pembroke | 1.34% | 0.21%(+1.13)#12 | 0.36%(+0.983)#2,686 |
| 13. | Clinton | 1.17% | 0.21%(+0.962)#13 | 0.36%(+0.811)#3,104 |
| 14. | Hudson | 1.13% | 0.21%(+0.923)#14 | 0.36%(+0.772)#3,217 |
| 15. | Maynard | 1.08% | 0.21%(+0.872)#15 | 0.36%(+0.720)#3,377 |
| 16. | Woburn | 1.04% | 0.21%(+0.833)#16 | 0.36%(+0.682)#3,471 |
| 17. | Great Barrington | 0.95% | 0.21%(+0.747)#17 | 0.36%(+0.595)#3,777 |
| 18. | Brewster | 0.92% | 0.21%(+0.714)#18 | 0.36%(+0.563)#3,891 |
| 19. | Harwich Center | 0.92% | 0.21%(+0.710)#19 | 0.36%(+0.559)#3,907 |
| 20. | Northborough | 0.90% | 0.21%(+0.693)#20 | 0.36%(+0.541)#3,966 |
| 21. | Pepperell | 0.86% | 0.21%(+0.656)#21 | 0.36%(+0.504)#4,107 |
| 22. | Forestdale | 0.84% | 0.21%(+0.638)#22 | 0.36%(+0.486)#4,191 |
| 23. | Wellesley | 0.82% | 0.21%(+0.611)#23 | 0.36%(+0.460)#4,306 |
| 24. | Mattapoisett Center | 0.79% | 0.21%(+0.588)#24 | 0.36%(+0.437)#4,403 |
| 25. | West Concord | 0.79% | 0.21%(+0.585)#25 | 0.36%(+0.433)#4,417 |
| 26. | Huntington | 0.69% | 0.21%(+0.488)#26 | 0.36%(+0.336)#4,897 |
| 27. | Chatham | 0.67% | 0.21%(+0.466)#27 | 0.36%(+0.315)#5,000 |
| 28. | Rockport | 0.67% | 0.21%(+0.462)#28 | 0.36%(+0.310)#5,025 |
| 29. | Franklin Town | 0.66% | 0.21%(+0.453)#29 | 0.36%(+0.302)#5,072 |
| 30. | Cochituate | 0.63% | 0.21%(+0.428)#30 | 0.36%(+0.277)#5,206 |
| 31. | Mashpee Neck | 0.63% | 0.21%(+0.424)#31 | 0.36%(+0.273)#5,225 |
| 32. | West Yarmouth | 0.62% | 0.21%(+0.417)#32 | 0.36%(+0.266)#5,254 |
| 33. | North Lakeville | 0.61% | 0.21%(+0.399)#33 | 0.36%(+0.248)#5,358 |
| 34. | Blandford | 0.57% | 0.21%(+0.367)#34 | 0.36%(+0.216)#5,532 |
| 35. | North Eastham | 0.56% | 0.21%(+0.352)#35 | 0.36%(+0.201)#5,620 |
| 36. | Ayer | 0.54% | 0.21%(+0.333)#36 | 0.36%(+0.182)#5,748 |
| 37. | Winchester | 0.53% | 0.21%(+0.320)#37 | 0.36%(+0.169)#5,833 |
| 38. | Saugus | 0.53% | 0.21%(+0.319)#38 | 0.36%(+0.168)#5,837 |
| 39. | Northampton | 0.50% | 0.21%(+0.290)#39 | 0.36%(+0.138)#6,034 |
| 40. | Holland | 0.48% | 0.21%(+0.276)#40 | 0.36%(+0.125)#6,129 |
| 41. | Brookline | 0.48% | 0.21%(+0.269)#41 | 0.36%(+0.118)#6,185 |
| 42. | Rutland | 0.47% | 0.21%(+0.268)#42 | 0.36%(+0.116)#6,202 |
| 43. | Teaticket | 0.45% | 0.21%(+0.243)#43 | 0.36%(+0.091)#6,387 |
| 44. | Pittsfield | 0.45% | 0.21%(+0.240)#44 | 0.36%(+0.089)#6,409 |
| 45. | Marblehead | 0.44% | 0.21%(+0.236)#45 | 0.36%(+0.085)#6,435 |
| 46. | Gloucester | 0.44% | 0.21%(+0.233)#46 | 0.36%(+0.082)#6,459 |
| 47. | Newburyport | 0.44% | 0.21%(+0.230)#47 | 0.36%(+0.079)#6,483 |
| 48. | Buzzards Bay | 0.43% | 0.21%(+0.228)#48 | 0.36%(+0.077)#6,499 |
| 49. | Amesbury Town | 0.43% | 0.21%(+0.228)#49 | 0.36%(+0.077)#6,504 |
| 50. | Greenfield | 0.43% | 0.21%(+0.224)#50 | 0.36%(+0.073)#6,527 |
| 51. | Watertown Town | 0.43% | 0.21%(+0.223)#51 | 0.36%(+0.072)#6,531 |
| 52. | Lexington | 0.42% | 0.21%(+0.215)#52 | 0.36%(+0.064)#6,593 |
| 53. | Cambridge | 0.42% | 0.21%(+0.214)#53 | 0.36%(+0.062)#6,602 |
| 54. | Arlington | 0.40% | 0.21%(+0.195)#54 | 0.36%(+0.044)#6,751 |
| 55. | Hanscom Afb | 0.39% | 0.21%(+0.187)#55 | 0.36%(+0.035)#6,830 |
| 56. | Salem | 0.39% | 0.21%(+0.180)#56 | 0.36%(+0.029)#6,901 |
| 57. | Hanson | 0.38% | 0.21%(+0.177)#57 | 0.36%(+0.026)#6,929 |
| 58. | South Yarmouth | 0.38% | 0.21%(+0.175)#58 | 0.36%(+0.024)#6,947 |
| 59. | Pocasset | 0.38% | 0.21%(+0.175)#59 | 0.36%(+0.023)#6,955 |
| 60. | Chester | 0.38% | 0.21%(+0.172)#60 | 0.36%(+0.020)#6,981 |
| 61. | Bridgewater Town | 0.38% | 0.21%(+0.169)#61 | 0.36%(+0.018)#6,999 |
| 62. | Raynham Center | 0.37% | 0.21%(+0.169)#62 | 0.36%(+0.017)#7,005 |
| 63. | Danvers | 0.37% | 0.21%(+0.167)#63 | 0.36%(+0.015)#7,027 |
| 64. | Melrose | 0.36% | 0.21%(+0.154)#64 | 0.36%(+0.002)#7,151 |
| 65. | South Dennis | 0.35% | 0.21%(+0.149)#65 | 0.36%(-0.003)#7,185 |
| 66. | Northwest Harwich | 0.32% | 0.21%(+0.113)#66 | 0.36%(-0.038)#7,497 |
| 67. | Belmont | 0.31% | 0.21%(+0.109)#67 | 0.36%(-0.042)#7,527 |
| 68. | Newton | 0.31% | 0.21%(+0.101)#68 | 0.36%(-0.051)#7,600 |
| 69. | Somerville | 0.29% | 0.21%(+0.086)#69 | 0.36%(-0.065)#7,756 |
| 70. | Norwood | 0.29% | 0.21%(+0.084)#70 | 0.36%(-0.067)#7,771 |
| 71. | Yarmouth Port | 0.28% | 0.21%(+0.079)#71 | 0.36%(-0.073)#7,830 |
| 72. | Easthampton Town | 0.28% | 0.21%(+0.073)#72 | 0.36%(-0.078)#7,906 |
| 73. | Athol | 0.27% | 0.21%(+0.067)#73 | 0.36%(-0.084)#7,971 |
| 74. | North Adams | 0.27% | 0.21%(+0.065)#74 | 0.36%(-0.087)#8,001 |
| 75. | Sturbridge | 0.27% | 0.21%(+0.064)#75 | 0.36%(-0.087)#8,010 |
| 76. | Amherst | 0.27% | 0.21%(+0.064)#76 | 0.36%(-0.088)#8,013 |
| 77. | Falmouth | 0.26% | 0.21%(+0.052)#77 | 0.36%(-0.100)#8,157 |
| 78. | Lynnfield | 0.25% | 0.21%(+0.042)#78 | 0.36%(-0.110)#8,270 |
| 79. | Holbrook | 0.25% | 0.21%(+0.041)#79 | 0.36%(-0.110)#8,279 |
| 80. | Sandwich | 0.24% | 0.21%(+0.032)#80 | 0.36%(-0.120)#8,415 |
| 81. | Attleboro | 0.22% | 0.21%(+0.018)#81 | 0.36%(-0.133)#8,590 |
| 82. | Nantucket | 0.22% | 0.21%(+0.014)#82 | 0.36%(-0.138)#8,657 |
| 83. | Framingham | 0.21% | 0.21%(+0.007)#83 | 0.36%(-0.144)#8,724 |
| 84. | East Sandwich | 0.21% | 0.21%(+0.005)#84 | 0.36%(-0.146)#8,746 |
| 85. | Barnstable Town | 0.20% | 0.21%(-0.006)#85 | 0.36%(-0.157)#8,888 |
| 86. | North Attleborough | 0.20% | 0.21%(-0.011)#86 | 0.36%(-0.162)#8,953 |
| 87. | Hull | 0.19% | 0.21%(-0.018)#87 | 0.36%(-0.169)#9,052 |
| 88. | Boston | 0.19% | 0.21%(-0.019)#88 | 0.36%(-0.170)#9,065 |
| 89. | Revere | 0.18% | 0.21%(-0.028)#89 | 0.36%(-0.179)#9,162 |
| 90. | Weymouth Town | 0.18% | 0.21%(-0.028)#90 | 0.36%(-0.179)#9,166 |
| 91. | Braintree Town | 0.17% | 0.21%(-0.033)#91 | 0.36%(-0.184)#9,230 |
| 92. | Marlborough | 0.17% | 0.21%(-0.039)#92 | 0.36%(-0.191)#9,308 |
| 93. | Middleborough Center | 0.17% | 0.21%(-0.039)#93 | 0.36%(-0.191)#9,313 |
| 94. | Quincy | 0.16% | 0.21%(-0.044)#94 | 0.36%(-0.196)#9,382 |
| 95. | Winthrop Town | 0.15% | 0.21%(-0.053)#95 | 0.36%(-0.205)#9,518 |
| 96. | Somerset | 0.15% | 0.21%(-0.058)#96 | 0.36%(-0.209)#9,585 |
| 97. | Leominster | 0.14% | 0.21%(-0.064)#97 | 0.36%(-0.215)#9,660 |
| 98. | Burlington | 0.14% | 0.21%(-0.068)#98 | 0.36%(-0.220)#9,713 |
| 99. | Medford | 0.13% | 0.21%(-0.075)#99 | 0.36%(-0.226)#9,801 |
| 100. | Andover | 0.13% | 0.21%(-0.078)#100 | 0.36%(-0.230)#9,854 |
Common Questions
What are the Top 10 Cities with the Highest Percentage of Danish Population in Massachusetts?
Top 10 Cities with the Highest Percentage of Danish Population in Massachusetts are:
#1
4.53%
#2
4.35%
#3
3.10%
#4
2.84%
#5
2.68%
#6
2.44%
#7
2.42%
#8
1.60%
#9
1.56%
#10
1.53%
What city has the Highest Percentage of Danish Population in Massachusetts?
Boxford has the Highest Percentage of Danish Population in Massachusetts with 4.53%.
What is the Percentage of Danish Population in the State of Massachusetts?
Percentage of Danish Population in Massachusetts is 0.21%.
What is the Percentage of Danish Population in the United States?
Percentage of Danish Population in the United States is 0.36%.