Zip Codes with the Highest Percentage of Population with a Degree in Social Sciences in Bellingham, WA
RELATED REPORTS & OPTIONS
Social Sciences
Bellingham
Compare Zip Codes
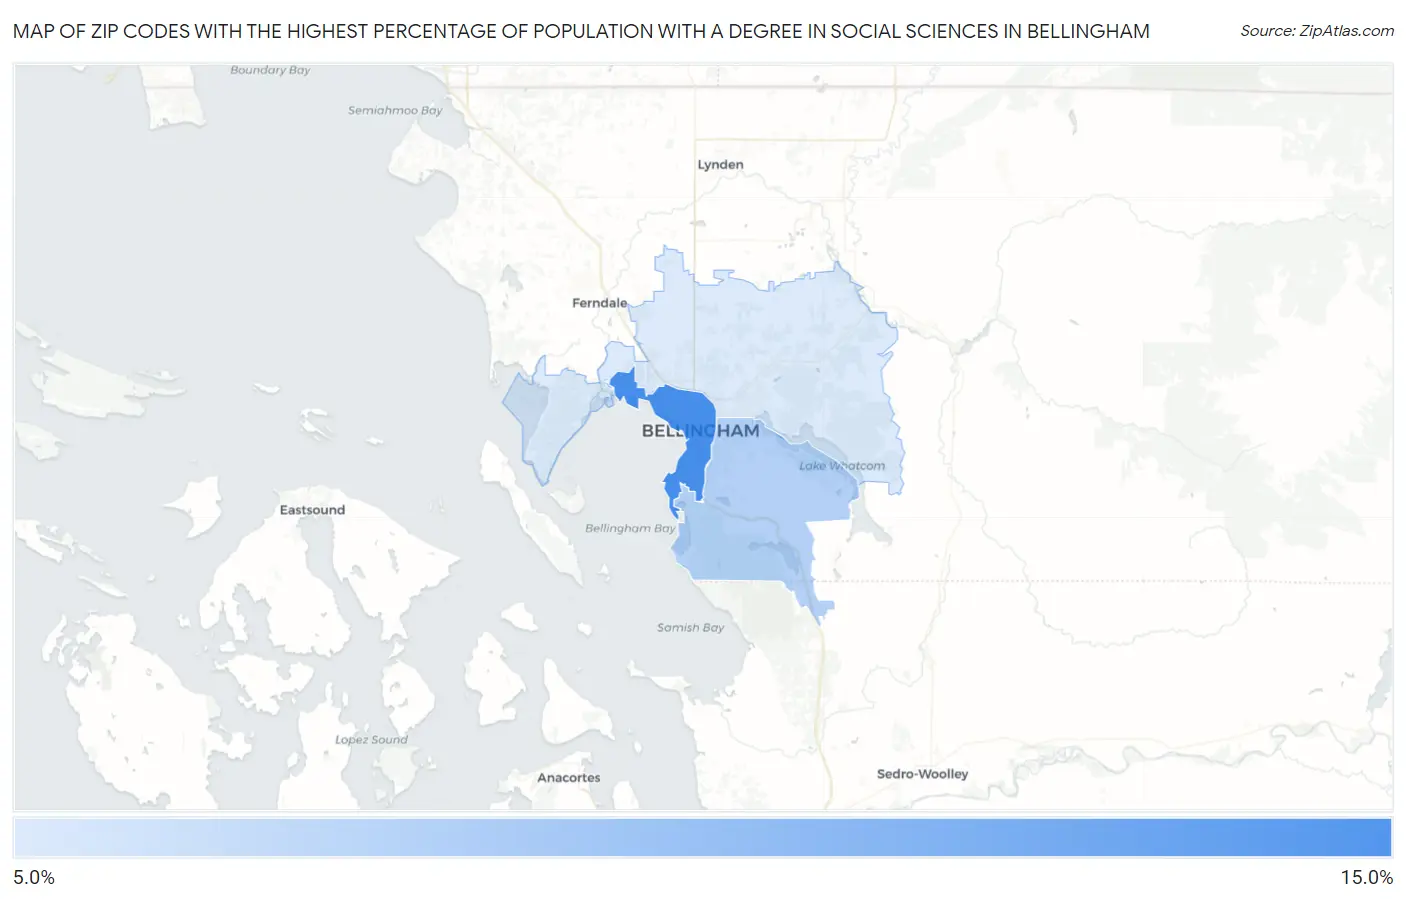
Map of Zip Codes with the Highest Percentage of Population with a Degree in Social Sciences in Bellingham
9.8%
11.6%
Zip Codes with the Highest Percentage of Population with a Degree in Social Sciences in Bellingham, WA
| Zip Code | % Graduates | vs State | vs National | |
| 1. | 98225 | 11.6% | 9.3%(+2.33)#92 | 8.1%(+3.56)#3,798 |
| 2. | 98229 | 10.3% | 9.3%(+1.02)#140 | 8.1%(+2.25)#5,163 |
| 3. | 98226 | 9.8% | 9.3%(+0.537)#159 | 8.1%(+1.76)#5,776 |
1
Common Questions
What are the Top Zip Codes with the Highest Percentage of Population with a Degree in Social Sciences in Bellingham, WA?
Top Zip Codes with the Highest Percentage of Population with a Degree in Social Sciences in Bellingham, WA are:
What zip code has the Highest Percentage of Population with a Degree in Social Sciences in Bellingham, WA?
98225 has the Highest Percentage of Population with a Degree in Social Sciences in Bellingham, WA with 11.6%.
What is the Percentage of Population with a Degree in Social Sciences in Bellingham, WA?
Percentage of Population with a Degree in Social Sciences in Bellingham is 11.3%.
What is the Percentage of Population with a Degree in Social Sciences in Washington?
Percentage of Population with a Degree in Social Sciences in Washington is 9.3%.
What is the Percentage of Population with a Degree in Social Sciences in the United States?
Percentage of Population with a Degree in Social Sciences in the United States is 8.1%.