Cities with the Most Immigrants from Western Asia in Georgia
RELATED REPORTS & OPTIONS
Western Asia
Georgia
Compare Cities
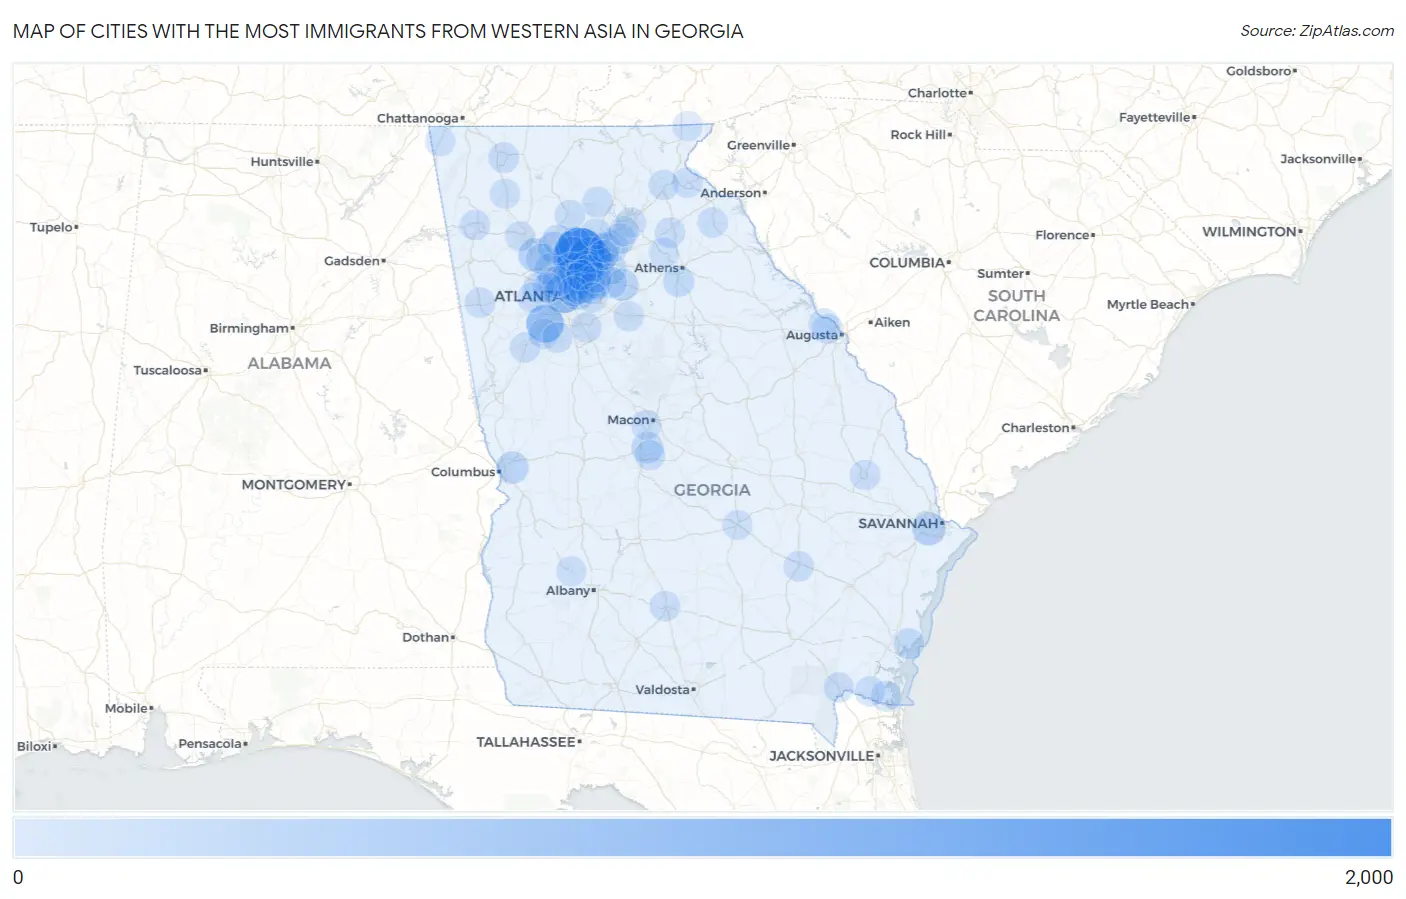
Map of Cities with the Most Immigrants from Western Asia in Georgia
0
2,000
Cities with the Most Immigrants from Western Asia in Georgia
| City | Western Asia | vs State | vs National | |
| 1. | Alpharetta | 1,545 | 17,767(8.70%)#1 | 1,204,112(0.13%)#82 |
| 2. | Johns Creek | 874 | 17,767(4.92%)#2 | 1,204,112(0.07%)#176 |
| 3. | Roswell | 716 | 17,767(4.03%)#3 | 1,204,112(0.06%)#225 |
| 4. | Atlanta | 640 | 17,767(3.60%)#4 | 1,204,112(0.05%)#261 |
| 5. | Fairburn | 583 | 17,767(3.28%)#5 | 1,204,112(0.05%)#288 |
| 6. | Sandy Springs | 462 | 17,767(2.60%)#6 | 1,204,112(0.04%)#371 |
| 7. | Duluth | 382 | 17,767(2.15%)#7 | 1,204,112(0.03%)#457 |
| 8. | Dunwoody | 349 | 17,767(1.96%)#8 | 1,204,112(0.03%)#497 |
| 9. | Athens-Clarke County Unified Government (Balance) | 315 | 17,767(1.77%)#9 | 1,204,112(0.03%)#552 |
| 10. | Brookhaven | 307 | 17,767(1.73%)#10 | 1,204,112(0.03%)#561 |
| 11. | Peachtree Corners | 278 | 17,767(1.56%)#11 | 1,204,112(0.02%)#624 |
| 12. | Augusta-Richmond County Consolidated Government (Balance) | 267 | 17,767(1.50%)#12 | 1,204,112(0.02%)#648 |
| 13. | Acworth | 243 | 17,767(1.37%)#13 | 1,204,112(0.02%)#718 |
| 14. | Savannah | 242 | 17,767(1.36%)#14 | 1,204,112(0.02%)#720 |
| 15. | Milton | 232 | 17,767(1.31%)#15 | 1,204,112(0.02%)#747 |
| 16. | Tucker | 220 | 17,767(1.24%)#16 | 1,204,112(0.02%)#775 |
| 17. | Decatur | 193 | 17,767(1.09%)#17 | 1,204,112(0.02%)#860 |
| 18. | Columbus | 160 | 17,767(0.90%)#18 | 1,204,112(0.01%)#994 |
| 19. | Loganville | 149 | 17,767(0.84%)#19 | 1,204,112(0.01%)#1,046 |
| 20. | Chamblee | 137 | 17,767(0.77%)#20 | 1,204,112(0.01%)#1,108 |
| 21. | Centerville | 128 | 17,767(0.72%)#21 | 1,204,112(0.01%)#1,175 |
| 22. | North Druid Hills | 113 | 17,767(0.64%)#22 | 1,204,112(0.01%)#1,273 |
| 23. | Woodstock | 107 | 17,767(0.60%)#23 | 1,204,112(0.01%)#1,335 |
| 24. | Buford | 97 | 17,767(0.55%)#24 | 1,204,112(0.01%)#1,406 |
| 25. | Watkinsville | 86 | 17,767(0.48%)#25 | 1,204,112(0.01%)#1,522 |
| 26. | Lawrenceville | 81 | 17,767(0.46%)#26 | 1,204,112(0.01%)#1,573 |
| 27. | Marietta | 76 | 17,767(0.43%)#27 | 1,204,112(0.01%)#1,632 |
| 28. | Snellville | 76 | 17,767(0.43%)#28 | 1,204,112(0.01%)#1,639 |
| 29. | Austell | 74 | 17,767(0.42%)#29 | 1,204,112(0.01%)#1,667 |
| 30. | Clarkston | 69 | 17,767(0.39%)#30 | 1,204,112(0.01%)#1,728 |
| 31. | North Decatur | 67 | 17,767(0.38%)#31 | 1,204,112(0.01%)#1,753 |
| 32. | St Simons | 67 | 17,767(0.38%)#32 | 1,204,112(0.01%)#1,754 |
| 33. | Mountain Park | 65 | 17,767(0.37%)#33 | 1,204,112(0.01%)#1,790 |
| 34. | Smyrna | 64 | 17,767(0.36%)#34 | 1,204,112(0.01%)#1,803 |
| 35. | Dalton | 55 | 17,767(0.31%)#35 | 1,204,112(0.00%)#1,954 |
| 36. | Dawsonville | 54 | 17,767(0.30%)#36 | 1,204,112(0.00%)#1,989 |
| 37. | Flowery Branch | 49 | 17,767(0.28%)#37 | 1,204,112(0.00%)#2,084 |
| 38. | Cumming | 47 | 17,767(0.26%)#38 | 1,204,112(0.00%)#2,133 |
| 39. | Stone Mountain | 43 | 17,767(0.24%)#39 | 1,204,112(0.00%)#2,228 |
| 40. | Newnan | 38 | 17,767(0.21%)#40 | 1,204,112(0.00%)#2,332 |
| 41. | Norcross | 38 | 17,767(0.21%)#41 | 1,204,112(0.00%)#2,339 |
| 42. | Tifton | 37 | 17,767(0.21%)#42 | 1,204,112(0.00%)#2,367 |
| 43. | Lilburn | 37 | 17,767(0.21%)#43 | 1,204,112(0.00%)#2,369 |
| 44. | Baxley | 35 | 17,767(0.20%)#44 | 1,204,112(0.00%)#2,433 |
| 45. | Sugar Hill | 34 | 17,767(0.19%)#45 | 1,204,112(0.00%)#2,445 |
| 46. | St Marys | 33 | 17,767(0.19%)#46 | 1,204,112(0.00%)#2,489 |
| 47. | Bremen | 33 | 17,767(0.19%)#47 | 1,204,112(0.00%)#2,505 |
| 48. | Stockbridge | 32 | 17,767(0.18%)#48 | 1,204,112(0.00%)#2,519 |
| 49. | Macon Bibb County | 31 | 17,767(0.17%)#49 | 1,204,112(0.00%)#2,541 |
| 50. | Warner Robins | 31 | 17,767(0.17%)#50 | 1,204,112(0.00%)#2,543 |
| 51. | Toccoa | 31 | 17,767(0.17%)#51 | 1,204,112(0.00%)#2,560 |
| 52. | Douglasville | 30 | 17,767(0.17%)#52 | 1,204,112(0.00%)#2,583 |
| 53. | Kennesaw | 28 | 17,767(0.16%)#53 | 1,204,112(0.00%)#2,660 |
| 54. | Holly Springs | 28 | 17,767(0.16%)#54 | 1,204,112(0.00%)#2,672 |
| 55. | Vinings | 26 | 17,767(0.15%)#55 | 1,204,112(0.00%)#2,774 |
| 56. | Commerce | 25 | 17,767(0.14%)#56 | 1,204,112(0.00%)#2,829 |
| 57. | Rome | 22 | 17,767(0.12%)#57 | 1,204,112(0.00%)#2,961 |
| 58. | Evans | 22 | 17,767(0.12%)#58 | 1,204,112(0.00%)#2,962 |
| 59. | Statesboro | 22 | 17,767(0.12%)#59 | 1,204,112(0.00%)#2,964 |
| 60. | Ball Ground | 22 | 17,767(0.12%)#60 | 1,204,112(0.00%)#3,006 |
| 61. | Royston | 22 | 17,767(0.12%)#61 | 1,204,112(0.00%)#3,007 |
| 62. | Mableton | 21 | 17,767(0.12%)#62 | 1,204,112(0.00%)#3,014 |
| 63. | Martinez | 19 | 17,767(0.11%)#63 | 1,204,112(0.00%)#3,115 |
| 64. | Tyrone | 18 | 17,767(0.10%)#64 | 1,204,112(0.00%)#3,203 |
| 65. | Jekyll Island | 18 | 17,767(0.10%)#65 | 1,204,112(0.00%)#3,240 |
| 66. | Suwanee | 16 | 17,767(0.09%)#66 | 1,204,112(0.00%)#3,326 |
| 67. | Kingsland | 16 | 17,767(0.09%)#67 | 1,204,112(0.00%)#3,329 |
| 68. | Folkston | 16 | 17,767(0.09%)#68 | 1,204,112(0.00%)#3,372 |
| 69. | Demorest | 16 | 17,767(0.09%)#69 | 1,204,112(0.00%)#3,382 |
| 70. | Fayetteville | 15 | 17,767(0.08%)#70 | 1,204,112(0.00%)#3,411 |
| 71. | Bemiss | 13 | 17,767(0.07%)#71 | 1,204,112(0.00%)#3,557 |
| 72. | Druid Hills | 12 | 17,767(0.07%)#72 | 1,204,112(0.00%)#3,631 |
| 73. | Calhoun | 10 | 17,767(0.06%)#73 | 1,204,112(0.00%)#3,793 |
| 74. | Gainesville | 9 | 17,767(0.05%)#74 | 1,204,112(0.00%)#3,887 |
| 75. | Mcrae Helena | 9 | 17,767(0.05%)#75 | 1,204,112(0.00%)#3,932 |
| 76. | Cartersville | 8 | 17,767(0.05%)#76 | 1,204,112(0.00%)#3,991 |
| 77. | Doraville | 8 | 17,767(0.05%)#77 | 1,204,112(0.00%)#4,007 |
| 78. | Covington | 7 | 17,767(0.04%)#78 | 1,204,112(0.00%)#4,101 |
| 79. | Arcade | 7 | 17,767(0.04%)#79 | 1,204,112(0.00%)#4,147 |
| 80. | Trenton | 4 | 17,767(0.02%)#80 | 1,204,112(0.00%)#4,374 |
| 81. | Redan | 3 | 17,767(0.02%)#81 | 1,204,112(0.00%)#4,424 |
| 82. | Oakwood | 3 | 17,767(0.02%)#82 | 1,204,112(0.00%)#4,439 |
| 83. | Sasser | 2 | 17,767(0.01%)#83 | 1,204,112(0.00%)#4,586 |
| 84. | Sky Valley | 1 | 17,767(0.01%)#84 | 1,204,112(0.00%)#4,630 |
Common Questions
What are the Top 10 Cities with the Most Immigrants from Western Asia in Georgia?
Top 10 Cities with the Most Immigrants from Western Asia in Georgia are:
#1
1,545
#2
874
#3
716
#4
640
#5
583
#6
462
#7
382
#8
349
#9
307
#10
278
What city has the Most Immigrants from Western Asia in Georgia?
Alpharetta has the Most Immigrants from Western Asia in Georgia with 1,545.
What is the Total Immigrants from Western Asia in the State of Georgia?
Total Immigrants from Western Asia in Georgia is 17,767.
What is the Total Immigrants from Western Asia in the United States?
Total Immigrants from Western Asia in the United States is 1,204,112.