Cities with the Most Immigrants from Western Asia in Alabama
RELATED REPORTS & OPTIONS
Western Asia
Alabama
Compare Cities
Map of Cities with the Most Immigrants from Western Asia in Alabama
0
1,000
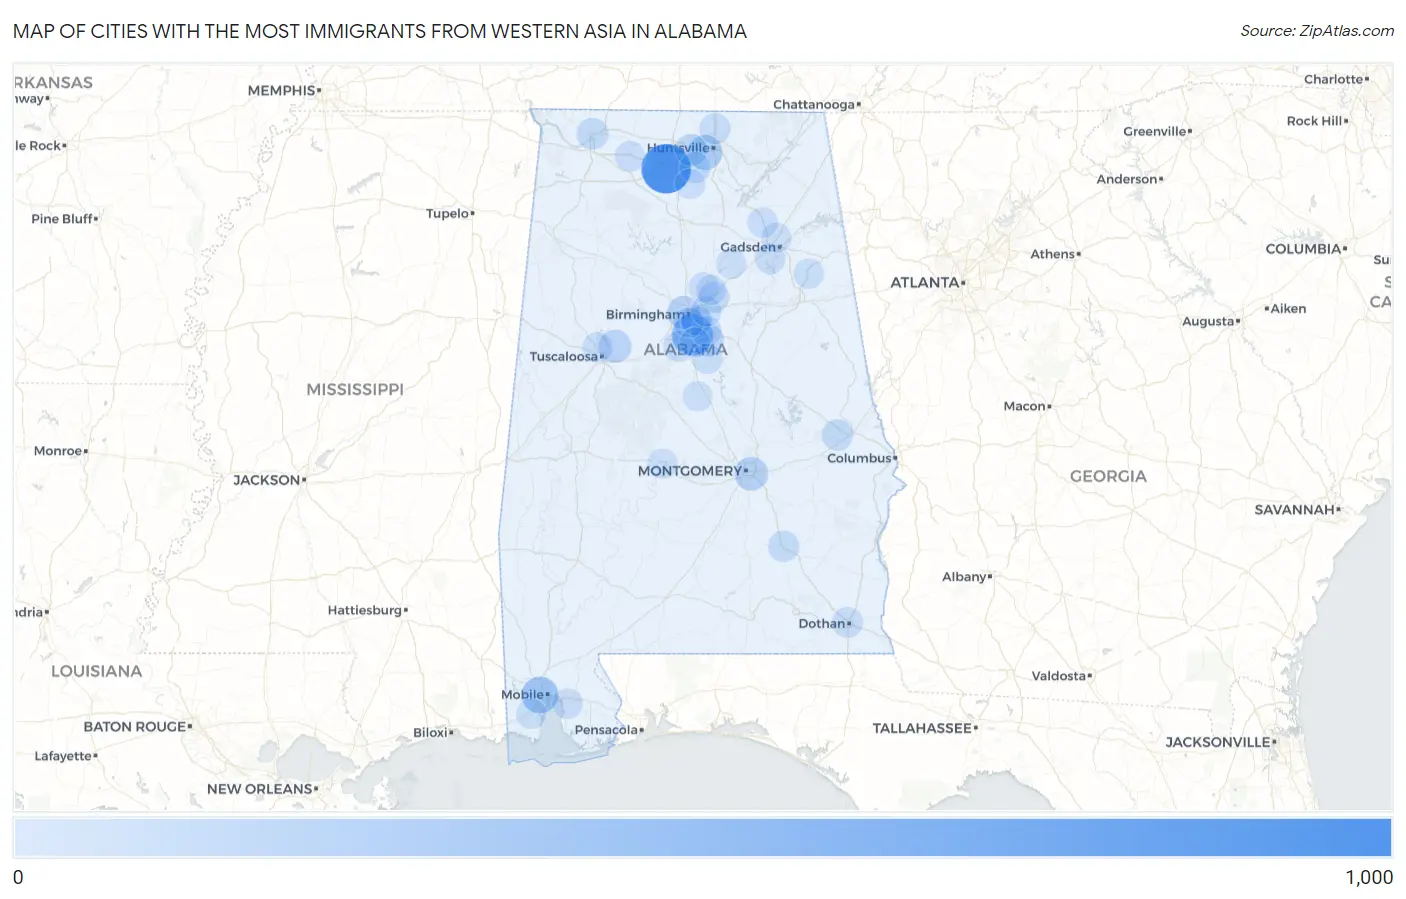
Cities with the Most Immigrants from Western Asia in Alabama
| City | Western Asia | vs State | vs National | |
| 1. | Decatur | 820 | 3,111(26.36%)#1 | 1,204,112(0.07%)#194 |
| 2. | Hoover | 457 | 3,111(14.69%)#2 | 1,204,112(0.04%)#375 |
| 3. | Mobile | 266 | 3,111(8.55%)#3 | 1,204,112(0.02%)#652 |
| 4. | Huntsville | 190 | 3,111(6.11%)#4 | 1,204,112(0.02%)#868 |
| 5. | Montgomery | 143 | 3,111(4.60%)#5 | 1,204,112(0.01%)#1,074 |
| 6. | Birmingham | 120 | 3,111(3.86%)#6 | 1,204,112(0.01%)#1,228 |
| 7. | Tuscaloosa | 114 | 3,111(3.66%)#7 | 1,204,112(0.01%)#1,265 |
| 8. | Chelsea | 106 | 3,111(3.41%)#8 | 1,204,112(0.01%)#1,345 |
| 9. | Madison | 78 | 3,111(2.51%)#9 | 1,204,112(0.01%)#1,605 |
| 10. | Florence | 60 | 3,111(1.93%)#10 | 1,204,112(0.00%)#1,877 |
| 11. | Auburn | 57 | 3,111(1.83%)#11 | 1,204,112(0.00%)#1,927 |
| 12. | Troy | 45 | 3,111(1.45%)#12 | 1,204,112(0.00%)#2,171 |
| 13. | Triana | 40 | 3,111(1.29%)#13 | 1,204,112(0.00%)#2,304 |
| 14. | Vestavia Hills | 39 | 3,111(1.25%)#14 | 1,204,112(0.00%)#2,308 |
| 15. | Dothan | 34 | 3,111(1.09%)#15 | 1,204,112(0.00%)#2,440 |
| 16. | Trussville | 33 | 3,111(1.06%)#16 | 1,204,112(0.00%)#2,482 |
| 17. | Meridianville | 33 | 3,111(1.06%)#17 | 1,204,112(0.00%)#2,499 |
| 18. | Helena | 27 | 3,111(0.87%)#18 | 1,204,112(0.00%)#2,717 |
| 19. | Mountain Brook | 19 | 3,111(0.61%)#19 | 1,204,112(0.00%)#3,122 |
| 20. | Highland Lakes | 16 | 3,111(0.51%)#20 | 1,204,112(0.00%)#3,368 |
| 21. | Daphne | 15 | 3,111(0.48%)#21 | 1,204,112(0.00%)#3,402 |
| 22. | Homewood | 15 | 3,111(0.48%)#22 | 1,204,112(0.00%)#3,404 |
| 23. | Courtland | 14 | 3,111(0.45%)#23 | 1,204,112(0.00%)#3,534 |
| 24. | Irondale | 12 | 3,111(0.39%)#24 | 1,204,112(0.00%)#3,615 |
| 25. | Rainbow City | 12 | 3,111(0.39%)#25 | 1,204,112(0.00%)#3,625 |
| 26. | Northport | 10 | 3,111(0.32%)#26 | 1,204,112(0.00%)#3,783 |
| 27. | Boaz | 9 | 3,111(0.29%)#27 | 1,204,112(0.00%)#3,917 |
| 28. | Pinson | 9 | 3,111(0.29%)#28 | 1,204,112(0.00%)#3,925 |
| 29. | Jacksonville | 8 | 3,111(0.26%)#29 | 1,204,112(0.00%)#4,002 |
| 30. | Clay | 7 | 3,111(0.23%)#30 | 1,204,112(0.00%)#4,108 |
| 31. | Theodore | 7 | 3,111(0.23%)#31 | 1,204,112(0.00%)#4,124 |
| 32. | Columbiana | 7 | 3,111(0.23%)#32 | 1,204,112(0.00%)#4,127 |
| 33. | Selma | 4 | 3,111(0.13%)#33 | 1,204,112(0.00%)#4,351 |
| 34. | Reece City | 4 | 3,111(0.13%)#34 | 1,204,112(0.00%)#4,407 |
| 35. | Pelham | 3 | 3,111(0.10%)#35 | 1,204,112(0.00%)#4,428 |
| 36. | Highland Lake | 3 | 3,111(0.10%)#36 | 1,204,112(0.00%)#4,505 |
| 37. | Thorsby | 2 | 3,111(0.06%)#37 | 1,204,112(0.00%)#4,531 |
| 38. | Somerville | 2 | 3,111(0.06%)#38 | 1,204,112(0.00%)#4,566 |
Common Questions
What are the Top 10 Cities with the Most Immigrants from Western Asia in Alabama?
Top 10 Cities with the Most Immigrants from Western Asia in Alabama are:
#1
820
#2
457
#3
266
#4
190
#5
143
#6
120
#7
114
#8
106
#9
78
#10
60
What city has the Most Immigrants from Western Asia in Alabama?
Decatur has the Most Immigrants from Western Asia in Alabama with 820.
What is the Total Immigrants from Western Asia in the State of Alabama?
Total Immigrants from Western Asia in Alabama is 3,111.
What is the Total Immigrants from Western Asia in the United States?
Total Immigrants from Western Asia in the United States is 1,204,112.