Cities with the Most Immigrants from Western Asia in Kansas
RELATED REPORTS & OPTIONS
Western Asia
Kansas
Compare Cities
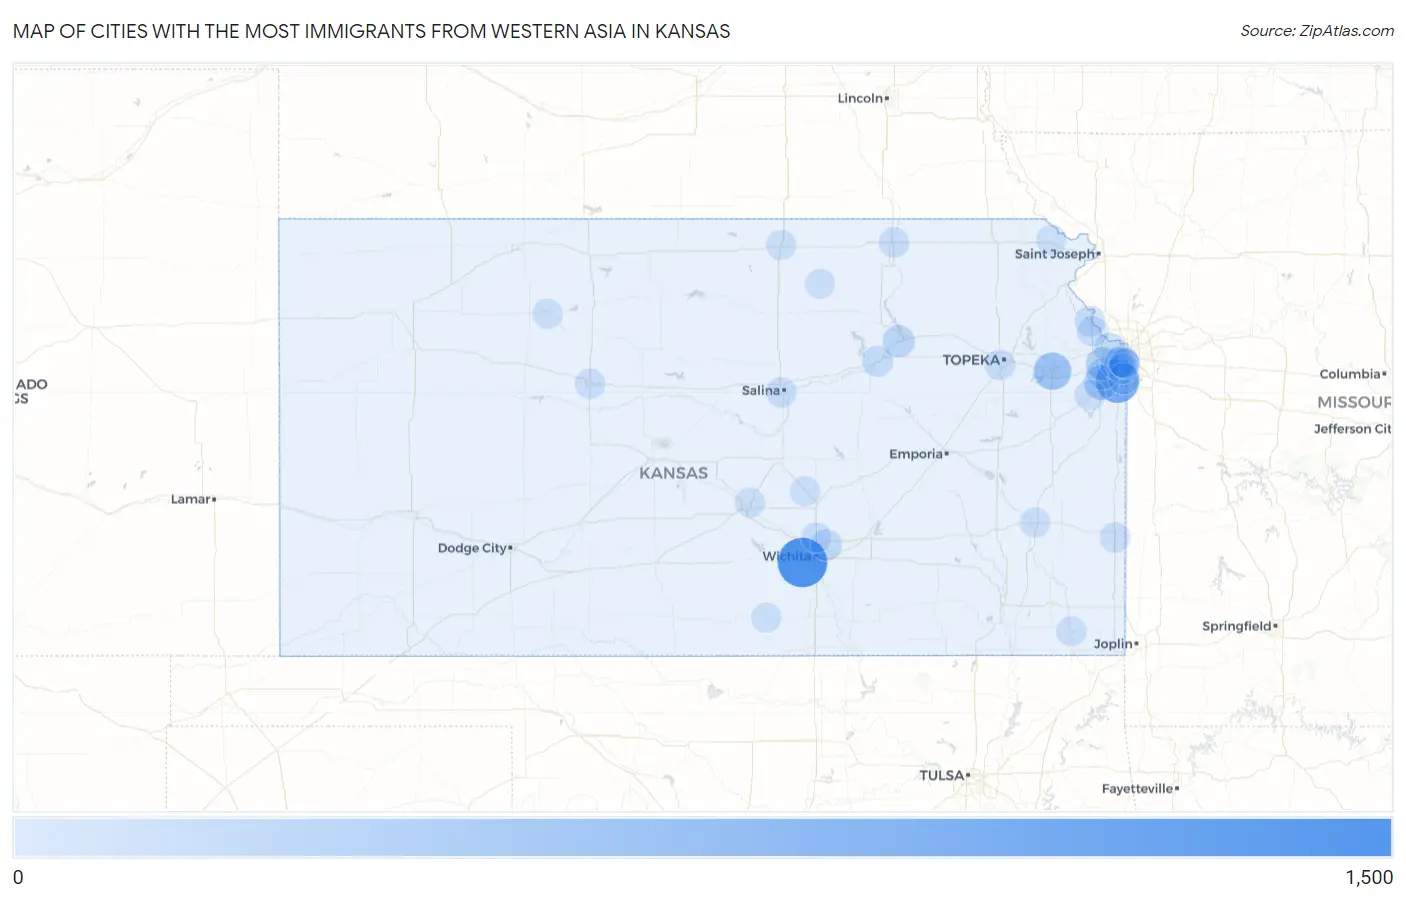
Map of Cities with the Most Immigrants from Western Asia in Kansas
0
1,500
Cities with the Most Immigrants from Western Asia in Kansas
| City | Western Asia | vs State | vs National | |
| 1. | Wichita | 1,301 | 4,423(29.41%)#1 | 1,204,112(0.11%)#102 |
| 2. | Overland Park | 863 | 4,423(19.51%)#2 | 1,204,112(0.07%)#181 |
| 3. | Lawrence | 475 | 4,423(10.74%)#3 | 1,204,112(0.04%)#358 |
| 4. | Olathe | 276 | 4,423(6.24%)#4 | 1,204,112(0.02%)#629 |
| 5. | Shawnee | 197 | 4,423(4.45%)#5 | 1,204,112(0.02%)#848 |
| 6. | Manhattan | 134 | 4,423(3.03%)#6 | 1,204,112(0.01%)#1,133 |
| 7. | Lenexa | 115 | 4,423(2.60%)#7 | 1,204,112(0.01%)#1,257 |
| 8. | Merriam | 103 | 4,423(2.33%)#8 | 1,204,112(0.01%)#1,363 |
| 9. | Roeland Park | 99 | 4,423(2.24%)#9 | 1,204,112(0.01%)#1,393 |
| 10. | Kansas City | 96 | 4,423(2.17%)#10 | 1,204,112(0.01%)#1,409 |
| 11. | Bel Aire | 95 | 4,423(2.15%)#11 | 1,204,112(0.01%)#1,425 |
| 12. | Grandview Plaza | 70 | 4,423(1.58%)#12 | 1,204,112(0.01%)#1,719 |
| 13. | Mission | 66 | 4,423(1.49%)#13 | 1,204,112(0.01%)#1,773 |
| 14. | Leawood | 65 | 4,423(1.47%)#14 | 1,204,112(0.01%)#1,785 |
| 15. | Leavenworth | 40 | 4,423(0.90%)#15 | 1,204,112(0.00%)#2,281 |
| 16. | Lansing | 36 | 4,423(0.81%)#16 | 1,204,112(0.00%)#2,401 |
| 17. | Topeka | 27 | 4,423(0.61%)#17 | 1,204,112(0.00%)#2,701 |
| 18. | Gardner | 20 | 4,423(0.45%)#18 | 1,204,112(0.00%)#3,066 |
| 19. | Prairie Village | 20 | 4,423(0.45%)#19 | 1,204,112(0.00%)#3,067 |
| 20. | Marysville | 18 | 4,423(0.41%)#20 | 1,204,112(0.00%)#3,230 |
| 21. | Fairway | 17 | 4,423(0.38%)#21 | 1,204,112(0.00%)#3,289 |
| 22. | Salina | 15 | 4,423(0.34%)#22 | 1,204,112(0.00%)#3,398 |
| 23. | Fort Scott | 15 | 4,423(0.34%)#23 | 1,204,112(0.00%)#3,434 |
| 24. | Park City | 14 | 4,423(0.32%)#24 | 1,204,112(0.00%)#3,506 |
| 25. | Mission Hills | 14 | 4,423(0.32%)#25 | 1,204,112(0.00%)#3,520 |
| 26. | Hays | 11 | 4,423(0.25%)#26 | 1,204,112(0.00%)#3,706 |
| 27. | Hutchinson | 9 | 4,423(0.20%)#27 | 1,204,112(0.00%)#3,890 |
| 28. | Belleville | 9 | 4,423(0.20%)#28 | 1,204,112(0.00%)#3,961 |
| 29. | Highland | 9 | 4,423(0.20%)#29 | 1,204,112(0.00%)#3,973 |
| 30. | Iola | 7 | 4,423(0.16%)#30 | 1,204,112(0.00%)#4,122 |
| 31. | Hesston | 5 | 4,423(0.11%)#31 | 1,204,112(0.00%)#4,289 |
| 32. | Oswego | 4 | 4,423(0.09%)#32 | 1,204,112(0.00%)#4,379 |
| 33. | Argonia | 4 | 4,423(0.09%)#33 | 1,204,112(0.00%)#4,409 |
| 34. | Bogue | 2 | 4,423(0.05%)#34 | 1,204,112(0.00%)#4,599 |
| 35. | Vining | 1 | 4,423(0.02%)#35 | 1,204,112(0.00%)#4,655 |
Common Questions
What are the Top 10 Cities with the Most Immigrants from Western Asia in Kansas?
Top 10 Cities with the Most Immigrants from Western Asia in Kansas are:
#1
1,301
#2
863
#3
475
#4
276
#5
197
#6
134
#7
115
#8
103
#9
99
#10
96
What city has the Most Immigrants from Western Asia in Kansas?
Wichita has the Most Immigrants from Western Asia in Kansas with 1,301.
What is the Total Immigrants from Western Asia in the State of Kansas?
Total Immigrants from Western Asia in Kansas is 4,423.
What is the Total Immigrants from Western Asia in the United States?
Total Immigrants from Western Asia in the United States is 1,204,112.