Cities with the Most Immigrants from Western Asia in Pennsylvania
RELATED REPORTS & OPTIONS
Western Asia
Pennsylvania
Compare Cities
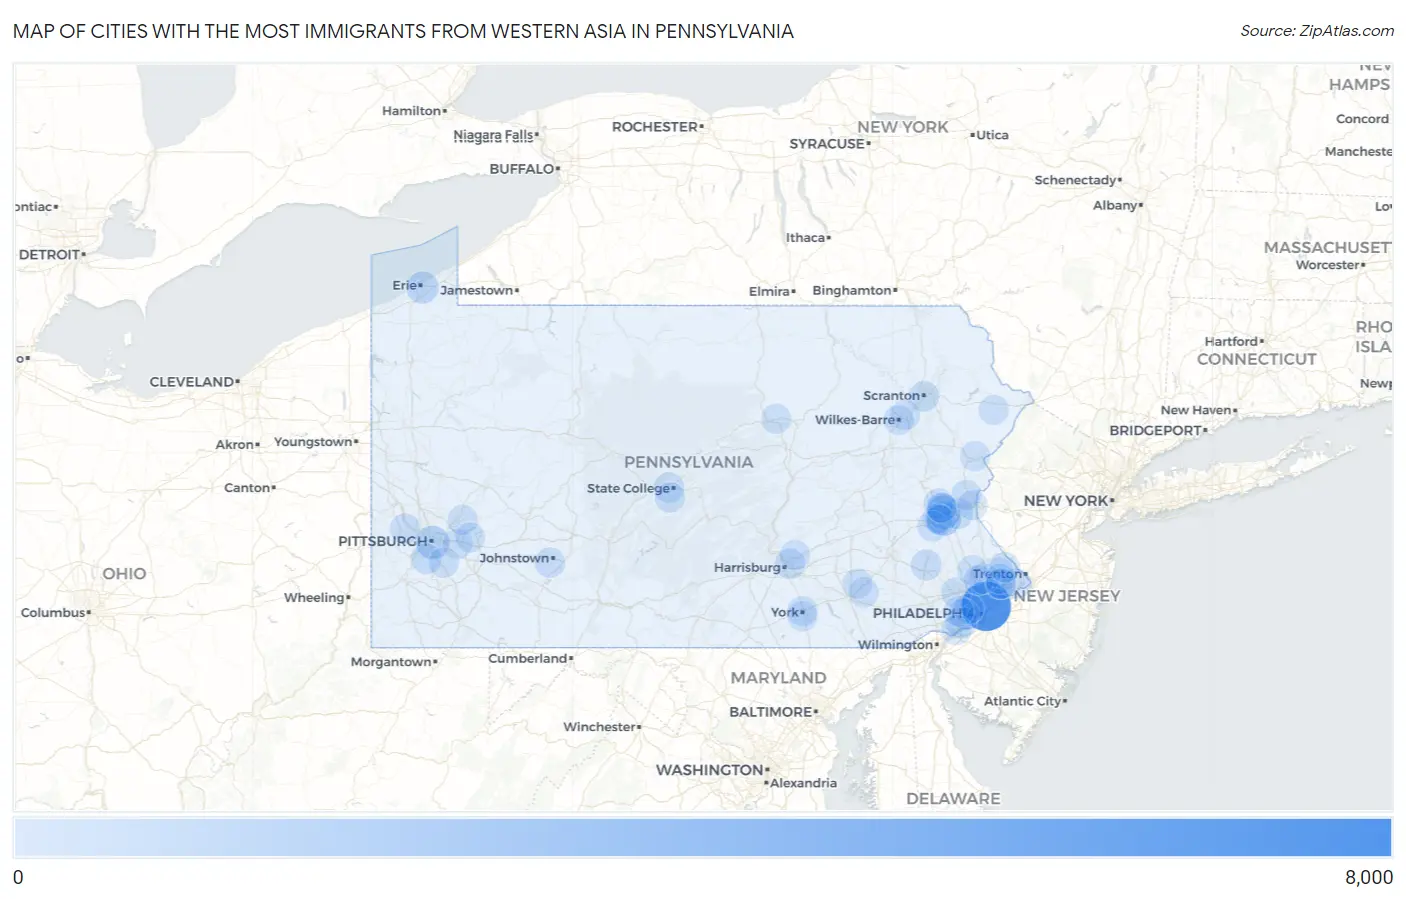
Map of Cities with the Most Immigrants from Western Asia in Pennsylvania
0
8,000
Cities with the Most Immigrants from Western Asia in Pennsylvania
| City | Western Asia | vs State | vs National | |
| 1. | Philadelphia | 6,627 | 27,662(23.96%)#1 | 1,204,112(0.55%)#13 |
| 2. | Allentown | 1,336 | 27,662(4.83%)#2 | 1,204,112(0.11%)#96 |
| 3. | Fullerton | 1,132 | 27,662(4.09%)#3 | 1,204,112(0.09%)#125 |
| 4. | Pittsburgh | 1,111 | 27,662(4.02%)#4 | 1,204,112(0.09%)#130 |
| 5. | Erie | 647 | 27,662(2.34%)#5 | 1,204,112(0.05%)#258 |
| 6. | State College Borough | 393 | 27,662(1.42%)#6 | 1,204,112(0.03%)#443 |
| 7. | Folsom | 349 | 27,662(1.26%)#7 | 1,204,112(0.03%)#498 |
| 8. | Bethlehem | 202 | 27,662(0.73%)#8 | 1,204,112(0.02%)#830 |
| 9. | Halfway House | 197 | 27,662(0.71%)#9 | 1,204,112(0.02%)#851 |
| 10. | Feasterville | 196 | 27,662(0.71%)#10 | 1,204,112(0.02%)#855 |
| 11. | Scranton | 177 | 27,662(0.64%)#11 | 1,204,112(0.01%)#918 |
| 12. | Bethel Park | 174 | 27,662(0.63%)#12 | 1,204,112(0.01%)#929 |
| 13. | Egypt | 174 | 27,662(0.63%)#13 | 1,204,112(0.01%)#931 |
| 14. | Hokendauqua | 172 | 27,662(0.62%)#14 | 1,204,112(0.01%)#937 |
| 15. | Park Forest Village | 144 | 27,662(0.52%)#15 | 1,204,112(0.01%)#1,073 |
| 16. | Phoenixville Borough | 140 | 27,662(0.51%)#16 | 1,204,112(0.01%)#1,088 |
| 17. | Indiana Borough | 136 | 27,662(0.49%)#17 | 1,204,112(0.01%)#1,116 |
| 18. | Bala Cynwyd | 135 | 27,662(0.49%)#18 | 1,204,112(0.01%)#1,125 |
| 19. | West Pittston Borough | 122 | 27,662(0.44%)#19 | 1,204,112(0.01%)#1,215 |
| 20. | Ancient Oaks | 121 | 27,662(0.44%)#20 | 1,204,112(0.01%)#1,224 |
| 21. | Whitehall Borough | 120 | 27,662(0.43%)#21 | 1,204,112(0.01%)#1,237 |
| 22. | Progress | 118 | 27,662(0.43%)#22 | 1,204,112(0.01%)#1,244 |
| 23. | King Of Prussia | 117 | 27,662(0.42%)#23 | 1,204,112(0.01%)#1,246 |
| 24. | Horsham | 112 | 27,662(0.40%)#24 | 1,204,112(0.01%)#1,284 |
| 25. | Hamburg Borough | 109 | 27,662(0.39%)#25 | 1,204,112(0.01%)#1,322 |
| 26. | Towanda Borough | 97 | 27,662(0.35%)#26 | 1,204,112(0.01%)#1,408 |
| 27. | Levittown | 89 | 27,662(0.32%)#27 | 1,204,112(0.01%)#1,481 |
| 28. | Drexel Hill | 88 | 27,662(0.32%)#28 | 1,204,112(0.01%)#1,492 |
| 29. | Downingtown Borough | 79 | 27,662(0.29%)#29 | 1,204,112(0.01%)#1,598 |
| 30. | Merion Station | 77 | 27,662(0.28%)#30 | 1,204,112(0.01%)#1,626 |
| 31. | Eastlawn Gardens | 72 | 27,662(0.26%)#31 | 1,204,112(0.01%)#1,692 |
| 32. | Chestnut Hill | 70 | 27,662(0.25%)#32 | 1,204,112(0.01%)#1,718 |
| 33. | Stroudsburg Borough | 67 | 27,662(0.24%)#33 | 1,204,112(0.01%)#1,759 |
| 34. | Carnot Moon | 66 | 27,662(0.24%)#34 | 1,204,112(0.01%)#1,772 |
| 35. | Mechanicsburg Borough | 65 | 27,662(0.23%)#35 | 1,204,112(0.01%)#1,793 |
| 36. | Penn Wynne | 64 | 27,662(0.23%)#36 | 1,204,112(0.01%)#1,816 |
| 37. | North East Borough | 63 | 27,662(0.23%)#37 | 1,204,112(0.01%)#1,837 |
| 38. | Jenkintown Borough | 61 | 27,662(0.22%)#38 | 1,204,112(0.01%)#1,872 |
| 39. | Elim | 61 | 27,662(0.22%)#39 | 1,204,112(0.01%)#1,874 |
| 40. | East Stroudsburg Borough | 60 | 27,662(0.22%)#40 | 1,204,112(0.00%)#1,890 |
| 41. | Chambersburg Borough | 55 | 27,662(0.20%)#41 | 1,204,112(0.00%)#1,955 |
| 42. | Leola | 53 | 27,662(0.19%)#42 | 1,204,112(0.00%)#2,006 |
| 43. | Frazer | 53 | 27,662(0.19%)#43 | 1,204,112(0.00%)#2,012 |
| 44. | Montgomeryville | 52 | 27,662(0.19%)#44 | 1,204,112(0.00%)#2,020 |
| 45. | Broomall | 51 | 27,662(0.18%)#45 | 1,204,112(0.00%)#2,043 |
| 46. | Wind Gap Borough | 51 | 27,662(0.18%)#46 | 1,204,112(0.00%)#2,050 |
| 47. | Richboro | 50 | 27,662(0.18%)#47 | 1,204,112(0.00%)#2,064 |
| 48. | Hudson | 49 | 27,662(0.18%)#48 | 1,204,112(0.00%)#2,095 |
| 49. | Easton | 47 | 27,662(0.17%)#49 | 1,204,112(0.00%)#2,120 |
| 50. | Carlisle Borough | 47 | 27,662(0.17%)#50 | 1,204,112(0.00%)#2,124 |
| 51. | Chester | 46 | 27,662(0.17%)#51 | 1,204,112(0.00%)#2,147 |
| 52. | Elizabethtown Borough | 46 | 27,662(0.17%)#52 | 1,204,112(0.00%)#2,154 |
| 53. | Linglestown | 45 | 27,662(0.16%)#53 | 1,204,112(0.00%)#2,184 |
| 54. | Roslyn | 43 | 27,662(0.16%)#54 | 1,204,112(0.00%)#2,223 |
| 55. | Arlington Heights | 43 | 27,662(0.16%)#55 | 1,204,112(0.00%)#2,230 |
| 56. | Maple Glen | 42 | 27,662(0.15%)#56 | 1,204,112(0.00%)#2,244 |
| 57. | Churchville | 42 | 27,662(0.15%)#57 | 1,204,112(0.00%)#2,246 |
| 58. | Trevose | 42 | 27,662(0.15%)#58 | 1,204,112(0.00%)#2,250 |
| 59. | Monroeville | 41 | 27,662(0.15%)#59 | 1,204,112(0.00%)#2,261 |
| 60. | Montoursville Borough | 41 | 27,662(0.15%)#60 | 1,204,112(0.00%)#2,272 |
| 61. | Kenmar | 41 | 27,662(0.15%)#61 | 1,204,112(0.00%)#2,273 |
| 62. | Hatboro Borough | 40 | 27,662(0.14%)#62 | 1,204,112(0.00%)#2,297 |
| 63. | Wayne | 40 | 27,662(0.14%)#63 | 1,204,112(0.00%)#2,300 |
| 64. | Grantley | 40 | 27,662(0.14%)#64 | 1,204,112(0.00%)#2,301 |
| 65. | Danville Borough | 39 | 27,662(0.14%)#65 | 1,204,112(0.00%)#2,323 |
| 66. | Catasauqua Borough | 38 | 27,662(0.14%)#66 | 1,204,112(0.00%)#2,350 |
| 67. | Baldwin Borough | 36 | 27,662(0.13%)#67 | 1,204,112(0.00%)#2,394 |
| 68. | Emmaus Borough | 36 | 27,662(0.13%)#68 | 1,204,112(0.00%)#2,400 |
| 69. | Newtown Grant | 35 | 27,662(0.13%)#69 | 1,204,112(0.00%)#2,432 |
| 70. | Middletown Borough | 33 | 27,662(0.12%)#70 | 1,204,112(0.00%)#2,500 |
| 71. | Swissvale Borough | 33 | 27,662(0.12%)#71 | 1,204,112(0.00%)#2,503 |
| 72. | Brookhaven Borough | 33 | 27,662(0.12%)#72 | 1,204,112(0.00%)#2,504 |
| 73. | Clairton | 32 | 27,662(0.12%)#73 | 1,204,112(0.00%)#2,533 |
| 74. | Sewickley Borough | 32 | 27,662(0.12%)#74 | 1,204,112(0.00%)#2,536 |
| 75. | Bridgeport Borough | 31 | 27,662(0.11%)#75 | 1,204,112(0.00%)#2,572 |
| 76. | Rosemont | 31 | 27,662(0.11%)#76 | 1,204,112(0.00%)#2,574 |
| 77. | Harveys Lake Borough | 31 | 27,662(0.11%)#77 | 1,204,112(0.00%)#2,576 |
| 78. | Lansdowne Borough | 30 | 27,662(0.11%)#78 | 1,204,112(0.00%)#2,592 |
| 79. | Media Borough | 30 | 27,662(0.11%)#79 | 1,204,112(0.00%)#2,602 |
| 80. | Kingston Borough | 29 | 27,662(0.10%)#80 | 1,204,112(0.00%)#2,628 |
| 81. | York | 27 | 27,662(0.10%)#81 | 1,204,112(0.00%)#2,704 |
| 82. | Lansdale Borough | 27 | 27,662(0.10%)#82 | 1,204,112(0.00%)#2,720 |
| 83. | Lower Burrell | 26 | 27,662(0.09%)#83 | 1,204,112(0.00%)#2,777 |
| 84. | Hemlock Farms | 26 | 27,662(0.09%)#84 | 1,204,112(0.00%)#2,789 |
| 85. | Cetronia | 26 | 27,662(0.09%)#85 | 1,204,112(0.00%)#2,794 |
| 86. | Sharpsburg Borough | 25 | 27,662(0.09%)#86 | 1,204,112(0.00%)#2,838 |
| 87. | Rothsville | 25 | 27,662(0.09%)#87 | 1,204,112(0.00%)#2,839 |
| 88. | Millersville Borough | 24 | 27,662(0.09%)#88 | 1,204,112(0.00%)#2,868 |
| 89. | Bellevue Borough | 24 | 27,662(0.09%)#89 | 1,204,112(0.00%)#2,870 |
| 90. | Camp Hill Borough | 24 | 27,662(0.09%)#90 | 1,204,112(0.00%)#2,871 |
| 91. | Fountain Hill Borough | 24 | 27,662(0.09%)#91 | 1,204,112(0.00%)#2,881 |
| 92. | Pine Grove Mills | 24 | 27,662(0.09%)#92 | 1,204,112(0.00%)#2,898 |
| 93. | Carnegie Borough | 23 | 27,662(0.08%)#93 | 1,204,112(0.00%)#2,929 |
| 94. | Hellertown Borough | 23 | 27,662(0.08%)#94 | 1,204,112(0.00%)#2,934 |
| 95. | Dorneyville | 23 | 27,662(0.08%)#95 | 1,204,112(0.00%)#2,939 |
| 96. | Wilkes Barre | 22 | 27,662(0.08%)#96 | 1,204,112(0.00%)#2,960 |
| 97. | Murrysville | 22 | 27,662(0.08%)#97 | 1,204,112(0.00%)#2,967 |
| 98. | Dunmore Borough | 22 | 27,662(0.08%)#98 | 1,204,112(0.00%)#2,975 |
| 99. | Stiles | 22 | 27,662(0.08%)#99 | 1,204,112(0.00%)#3,010 |
| 100. | Kutztown Borough | 21 | 27,662(0.08%)#100 | 1,204,112(0.00%)#3,048 |
Common Questions
What are the Top 10 Cities with the Most Immigrants from Western Asia in Pennsylvania?
Top 10 Cities with the Most Immigrants from Western Asia in Pennsylvania are:
#1
6,627
#2
1,336
#3
1,132
#4
1,111
#5
647
#6
349
#7
202
#8
197
#9
196
#10
177
What city has the Most Immigrants from Western Asia in Pennsylvania?
Philadelphia has the Most Immigrants from Western Asia in Pennsylvania with 6,627.
What is the Total Immigrants from Western Asia in the State of Pennsylvania?
Total Immigrants from Western Asia in Pennsylvania is 27,662.
What is the Total Immigrants from Western Asia in the United States?
Total Immigrants from Western Asia in the United States is 1,204,112.