Cities with the Most Immigrants from Western Asia in Mississippi
RELATED REPORTS & OPTIONS
Western Asia
Mississippi
Compare Cities
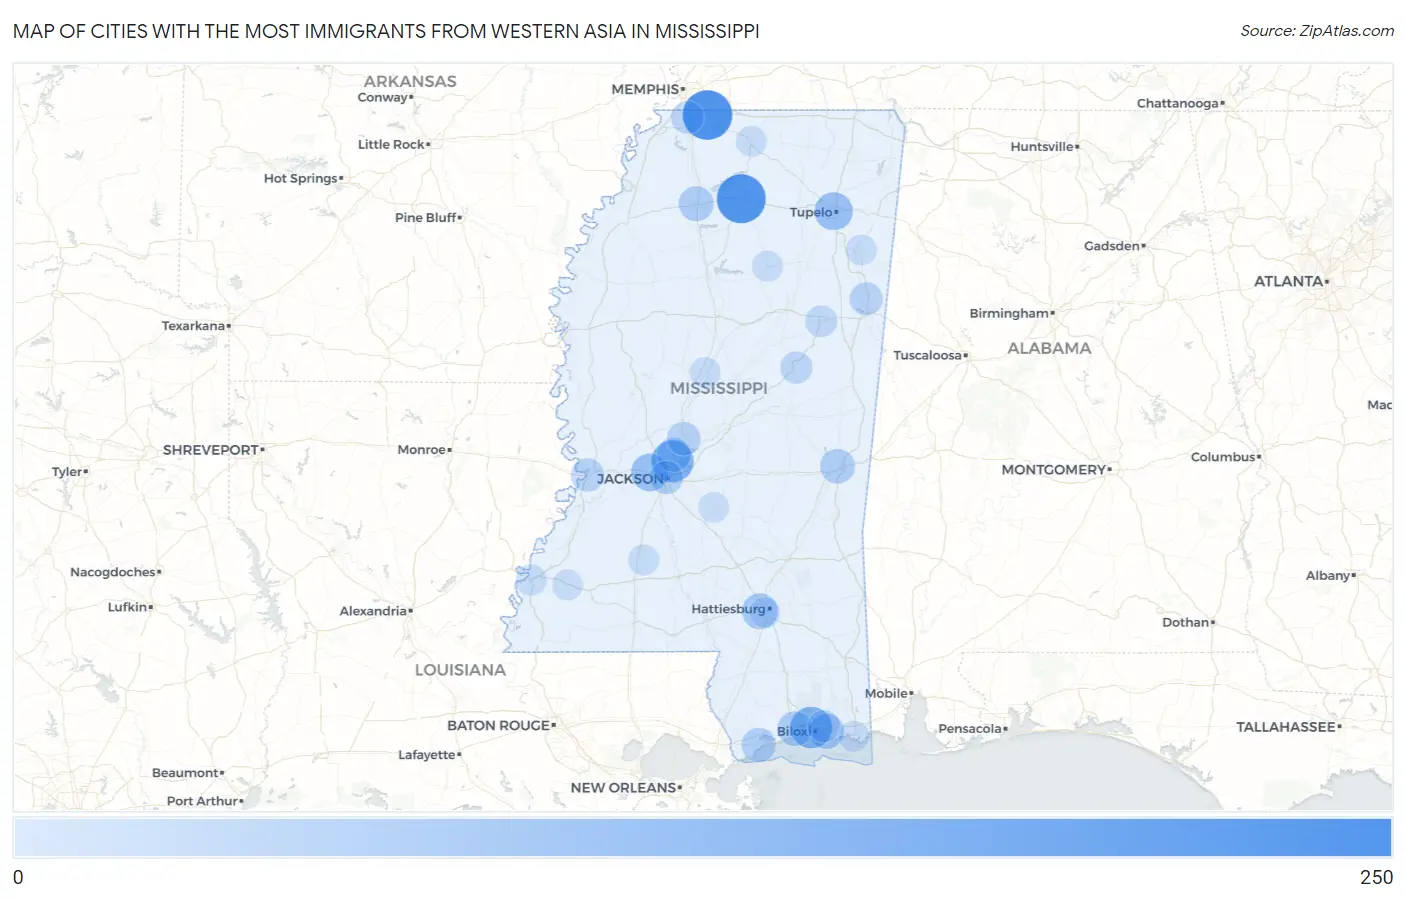
Map of Cities with the Most Immigrants from Western Asia in Mississippi
0
250
Cities with the Most Immigrants from Western Asia in Mississippi
| City | Western Asia | vs State | vs National | |
| 1. | Olive Branch | 207 | 1,907(10.85%)#1 | 1,204,112(0.02%)#817 |
| 2. | Oxford | 200 | 1,907(10.49%)#2 | 1,204,112(0.02%)#838 |
| 3. | Ridgeland | 126 | 1,907(6.61%)#3 | 1,204,112(0.01%)#1,186 |
| 4. | Biloxi | 121 | 1,907(6.35%)#4 | 1,204,112(0.01%)#1,219 |
| 5. | Tupelo | 82 | 1,907(4.30%)#5 | 1,204,112(0.01%)#1,556 |
| 6. | Clinton | 80 | 1,907(4.20%)#6 | 1,204,112(0.01%)#1,586 |
| 7. | West Hattiesburg | 60 | 1,907(3.15%)#7 | 1,204,112(0.00%)#1,893 |
| 8. | Ocean Springs | 54 | 1,907(2.83%)#8 | 1,204,112(0.00%)#1,980 |
| 9. | Batesville | 49 | 1,907(2.57%)#9 | 1,204,112(0.00%)#2,087 |
| 10. | Gulfport | 48 | 1,907(2.52%)#10 | 1,204,112(0.00%)#2,096 |
| 11. | Meridian | 46 | 1,907(2.41%)#11 | 1,204,112(0.00%)#2,145 |
| 12. | Waveland | 42 | 1,907(2.20%)#12 | 1,204,112(0.00%)#2,242 |
| 13. | Madison | 40 | 1,907(2.10%)#13 | 1,204,112(0.00%)#2,285 |
| 14. | Canton | 35 | 1,907(1.84%)#14 | 1,204,112(0.00%)#2,424 |
| 15. | Jackson | 33 | 1,907(1.73%)#15 | 1,204,112(0.00%)#2,471 |
| 16. | Vicksburg | 31 | 1,907(1.63%)#16 | 1,204,112(0.00%)#2,553 |
| 17. | Columbus Afb | 30 | 1,907(1.57%)#17 | 1,204,112(0.00%)#2,611 |
| 18. | Southaven | 27 | 1,907(1.42%)#18 | 1,204,112(0.00%)#2,702 |
| 19. | Gulf Hills | 22 | 1,907(1.15%)#19 | 1,204,112(0.00%)#2,984 |
| 20. | Louisville | 21 | 1,907(1.10%)#20 | 1,204,112(0.00%)#3,039 |
| 21. | Starkville | 17 | 1,907(0.89%)#21 | 1,204,112(0.00%)#3,254 |
| 22. | Bolivar | 10 | 1,907(0.52%)#22 | 1,204,112(0.00%)#3,881 |
| 23. | Natchez | 9 | 1,907(0.47%)#23 | 1,204,112(0.00%)#3,906 |
| 24. | Holly Springs | 8 | 1,907(0.42%)#24 | 1,204,112(0.00%)#4,027 |
| 25. | Wesson | 8 | 1,907(0.42%)#25 | 1,204,112(0.00%)#4,054 |
| 26. | Calhoun City | 8 | 1,907(0.42%)#26 | 1,204,112(0.00%)#4,058 |
| 27. | Pascagoula | 7 | 1,907(0.37%)#27 | 1,204,112(0.00%)#4,086 |
| 28. | Durant | 7 | 1,907(0.37%)#28 | 1,204,112(0.00%)#4,145 |
| 29. | Amory | 6 | 1,907(0.31%)#29 | 1,204,112(0.00%)#4,200 |
| 30. | Roxie | 6 | 1,907(0.31%)#30 | 1,204,112(0.00%)#4,241 |
| 31. | Hattiesburg | 5 | 1,907(0.26%)#31 | 1,204,112(0.00%)#4,258 |
| 32. | Puckett | 5 | 1,907(0.26%)#32 | 1,204,112(0.00%)#4,339 |
Common Questions
What are the Top 10 Cities with the Most Immigrants from Western Asia in Mississippi?
Top 10 Cities with the Most Immigrants from Western Asia in Mississippi are:
#1
207
#2
200
#3
126
#4
121
#5
82
#6
80
#7
60
#8
54
#9
49
#10
48
What city has the Most Immigrants from Western Asia in Mississippi?
Olive Branch has the Most Immigrants from Western Asia in Mississippi with 207.
What is the Total Immigrants from Western Asia in the State of Mississippi?
Total Immigrants from Western Asia in Mississippi is 1,907.
What is the Total Immigrants from Western Asia in the United States?
Total Immigrants from Western Asia in the United States is 1,204,112.