Cities with the Most Immigrants from Western Asia in Oklahoma
RELATED REPORTS & OPTIONS
Western Asia
Oklahoma
Compare Cities
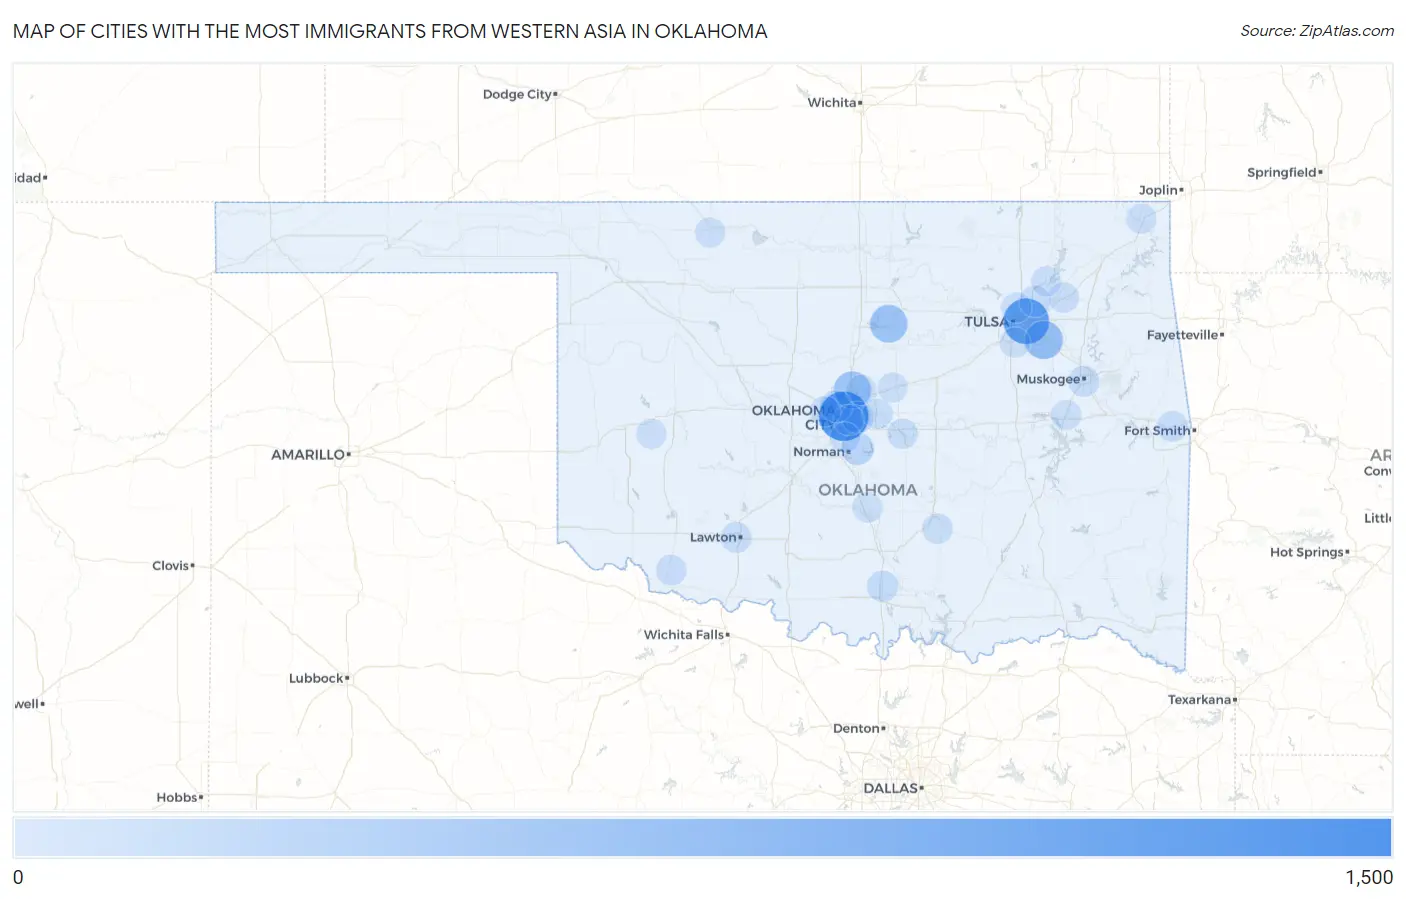
Map of Cities with the Most Immigrants from Western Asia in Oklahoma
0
1,500
Cities with the Most Immigrants from Western Asia in Oklahoma
| City | Western Asia | vs State | vs National | |
| 1. | Oklahoma City | 1,178 | 4,364(26.99%)#1 | 1,204,112(0.10%)#120 |
| 2. | Tulsa | 943 | 4,364(21.61%)#2 | 1,204,112(0.08%)#159 |
| 3. | Broken Arrow | 486 | 4,364(11.14%)#3 | 1,204,112(0.04%)#351 |
| 4. | Stillwater | 440 | 4,364(10.08%)#4 | 1,204,112(0.04%)#390 |
| 5. | Edmond | 419 | 4,364(9.60%)#5 | 1,204,112(0.03%)#416 |
| 6. | Norman | 134 | 4,364(3.07%)#6 | 1,204,112(0.01%)#1,128 |
| 7. | Midwest City | 99 | 4,364(2.27%)#7 | 1,204,112(0.01%)#1,383 |
| 8. | Nichols Hills | 91 | 4,364(2.09%)#8 | 1,204,112(0.01%)#1,465 |
| 9. | Owasso | 65 | 4,364(1.49%)#9 | 1,204,112(0.01%)#1,784 |
| 10. | Ardmore | 52 | 4,364(1.19%)#10 | 1,204,112(0.00%)#2,018 |
| 11. | Lawton | 41 | 4,364(0.94%)#11 | 1,204,112(0.00%)#2,254 |
| 12. | Muskogee | 40 | 4,364(0.92%)#12 | 1,204,112(0.00%)#2,282 |
| 13. | Muldrow | 29 | 4,364(0.66%)#13 | 1,204,112(0.00%)#2,646 |
| 14. | Frederick | 17 | 4,364(0.39%)#14 | 1,204,112(0.00%)#3,292 |
| 15. | Shawnee | 12 | 4,364(0.27%)#15 | 1,204,112(0.00%)#3,603 |
| 16. | Claremore | 11 | 4,364(0.25%)#16 | 1,204,112(0.00%)#3,708 |
| 17. | Ada | 11 | 4,364(0.25%)#17 | 1,204,112(0.00%)#3,713 |
| 18. | Harrah | 10 | 4,364(0.23%)#18 | 1,204,112(0.00%)#3,830 |
| 19. | Del City | 8 | 4,364(0.18%)#19 | 1,204,112(0.00%)#3,993 |
| 20. | Turley | 7 | 4,364(0.16%)#20 | 1,204,112(0.00%)#4,138 |
| 21. | Checotah | 6 | 4,364(0.14%)#21 | 1,204,112(0.00%)#4,216 |
| 22. | Mehan | 6 | 4,364(0.14%)#22 | 1,204,112(0.00%)#4,257 |
| 23. | Jenks | 5 | 4,364(0.11%)#23 | 1,204,112(0.00%)#4,264 |
| 24. | Bethany | 5 | 4,364(0.11%)#24 | 1,204,112(0.00%)#4,266 |
| 25. | Alva | 5 | 4,364(0.11%)#25 | 1,204,112(0.00%)#4,282 |
| 26. | Paoli | 4 | 4,364(0.09%)#26 | 1,204,112(0.00%)#4,408 |
| 27. | Arcadia | 4 | 4,364(0.09%)#27 | 1,204,112(0.00%)#4,417 |
| 28. | Oologah | 3 | 4,364(0.07%)#28 | 1,204,112(0.00%)#4,459 |
| 29. | Wellston | 3 | 4,364(0.07%)#29 | 1,204,112(0.00%)#4,497 |
| 30. | Moore | 2 | 4,364(0.05%)#30 | 1,204,112(0.00%)#4,510 |
| 31. | Miami | 2 | 4,364(0.05%)#31 | 1,204,112(0.00%)#4,517 |
| 32. | Burns Flat | 2 | 4,364(0.05%)#32 | 1,204,112(0.00%)#4,537 |
Common Questions
What are the Top 10 Cities with the Most Immigrants from Western Asia in Oklahoma?
Top 10 Cities with the Most Immigrants from Western Asia in Oklahoma are:
#1
1,178
#2
943
#3
486
#4
440
#5
419
#6
134
#7
99
#8
91
#9
65
#10
52
What city has the Most Immigrants from Western Asia in Oklahoma?
Oklahoma City has the Most Immigrants from Western Asia in Oklahoma with 1,178.
What is the Total Immigrants from Western Asia in the State of Oklahoma?
Total Immigrants from Western Asia in Oklahoma is 4,364.
What is the Total Immigrants from Western Asia in the United States?
Total Immigrants from Western Asia in the United States is 1,204,112.