Cities with the Most Immigrants from Western Asia in Colorado
RELATED REPORTS & OPTIONS
Western Asia
Colorado
Compare Cities
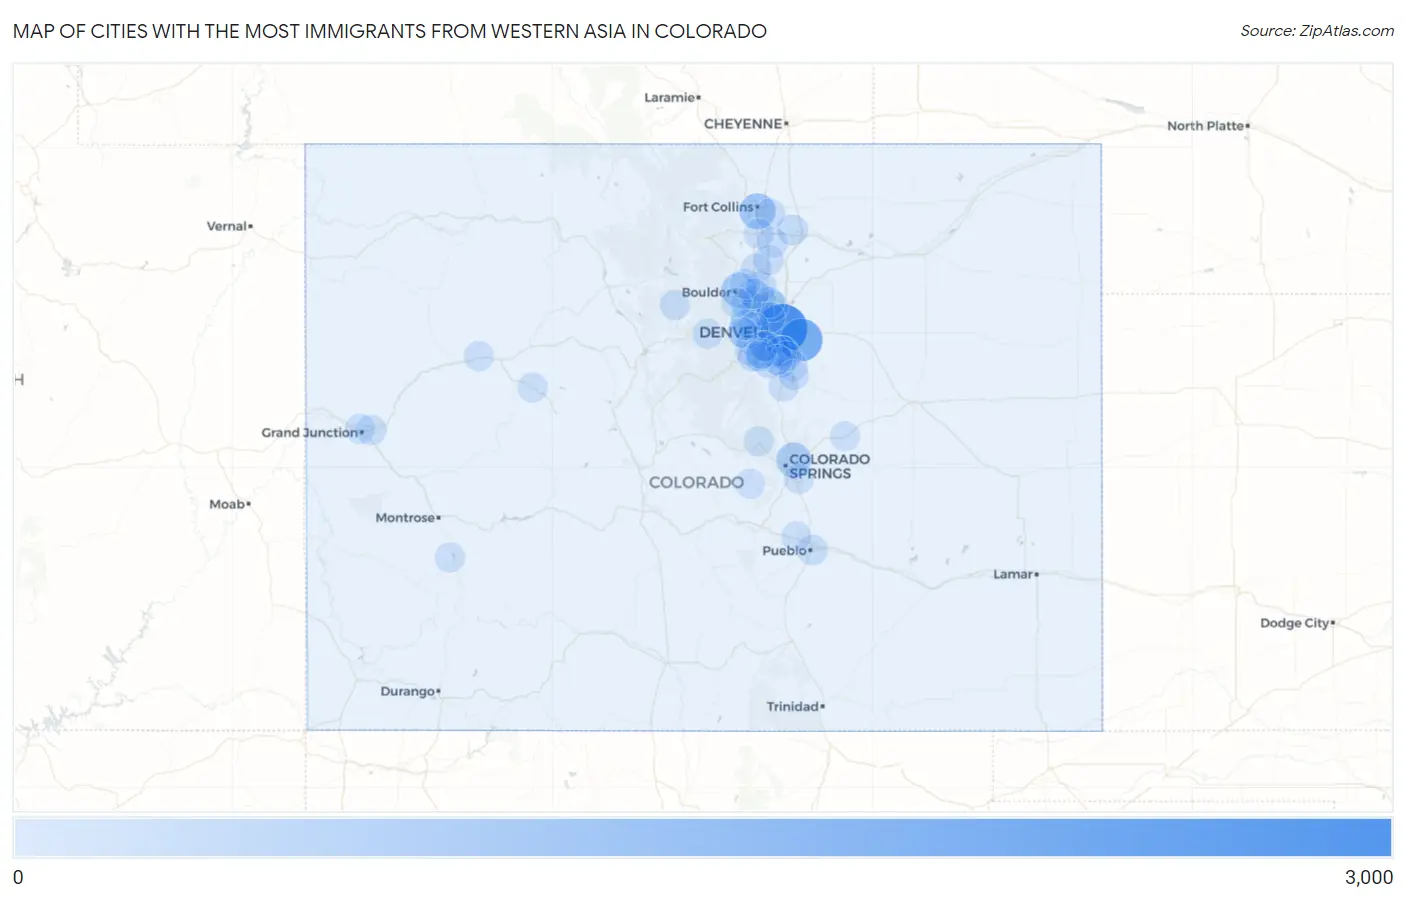
Map of Cities with the Most Immigrants from Western Asia in Colorado
0
3,000
Cities with the Most Immigrants from Western Asia in Colorado
| City | Western Asia | vs State | vs National | |
| 1. | Denver | 2,573 | 10,882(23.64%)#1 | 1,204,112(0.21%)#43 |
| 2. | Aurora | 1,637 | 10,882(15.04%)#2 | 1,204,112(0.14%)#75 |
| 3. | Fort Collins | 757 | 10,882(6.96%)#3 | 1,204,112(0.06%)#212 |
| 4. | Four Square Mile | 693 | 10,882(6.37%)#4 | 1,204,112(0.06%)#234 |
| 5. | Colorado Springs | 610 | 10,882(5.61%)#5 | 1,204,112(0.05%)#277 |
| 6. | Boulder | 581 | 10,882(5.34%)#6 | 1,204,112(0.05%)#290 |
| 7. | Broomfield | 342 | 10,882(3.14%)#7 | 1,204,112(0.03%)#508 |
| 8. | Centennial | 338 | 10,882(3.11%)#8 | 1,204,112(0.03%)#516 |
| 9. | Westminster | 289 | 10,882(2.66%)#9 | 1,204,112(0.02%)#599 |
| 10. | Greenwood Village | 201 | 10,882(1.85%)#10 | 1,204,112(0.02%)#835 |
| 11. | Arvada | 181 | 10,882(1.66%)#11 | 1,204,112(0.02%)#904 |
| 12. | Highlands Ranch | 168 | 10,882(1.54%)#12 | 1,204,112(0.01%)#947 |
| 13. | Thornton | 162 | 10,882(1.49%)#13 | 1,204,112(0.01%)#985 |
| 14. | Greeley | 134 | 10,882(1.23%)#14 | 1,204,112(0.01%)#1,129 |
| 15. | Northglenn | 132 | 10,882(1.21%)#15 | 1,204,112(0.01%)#1,144 |
| 16. | Lakewood | 120 | 10,882(1.10%)#16 | 1,204,112(0.01%)#1,229 |
| 17. | Dakota Ridge | 97 | 10,882(0.89%)#17 | 1,204,112(0.01%)#1,403 |
| 18. | Superior | 87 | 10,882(0.80%)#18 | 1,204,112(0.01%)#1,507 |
| 19. | Longmont | 72 | 10,882(0.66%)#19 | 1,204,112(0.01%)#1,683 |
| 20. | Pueblo | 65 | 10,882(0.60%)#20 | 1,204,112(0.01%)#1,778 |
| 21. | Erie | 63 | 10,882(0.58%)#21 | 1,204,112(0.01%)#1,827 |
| 22. | Littleton | 62 | 10,882(0.57%)#22 | 1,204,112(0.01%)#1,844 |
| 23. | Parker | 61 | 10,882(0.56%)#23 | 1,204,112(0.01%)#1,860 |
| 24. | Cherry Creek | 59 | 10,882(0.54%)#24 | 1,204,112(0.00%)#1,905 |
| 25. | Fraser | 53 | 10,882(0.49%)#25 | 1,204,112(0.00%)#2,013 |
| 26. | Castle Rock | 49 | 10,882(0.45%)#26 | 1,204,112(0.00%)#2,071 |
| 27. | Englewood | 47 | 10,882(0.43%)#27 | 1,204,112(0.00%)#2,118 |
| 28. | Ken Caryl | 39 | 10,882(0.36%)#28 | 1,204,112(0.00%)#2,310 |
| 29. | Johnstown | 39 | 10,882(0.36%)#29 | 1,204,112(0.00%)#2,317 |
| 30. | Timnath | 38 | 10,882(0.35%)#30 | 1,204,112(0.00%)#2,349 |
| 31. | Clifton | 33 | 10,882(0.30%)#31 | 1,204,112(0.00%)#2,487 |
| 32. | Loveland | 31 | 10,882(0.28%)#32 | 1,204,112(0.00%)#2,544 |
| 33. | West Pleasant View | 31 | 10,882(0.28%)#33 | 1,204,112(0.00%)#2,571 |
| 34. | Welby | 29 | 10,882(0.27%)#34 | 1,204,112(0.00%)#2,624 |
| 35. | Lone Tree | 28 | 10,882(0.26%)#35 | 1,204,112(0.00%)#2,676 |
| 36. | Mead | 27 | 10,882(0.25%)#36 | 1,204,112(0.00%)#2,742 |
| 37. | Lafayette | 23 | 10,882(0.21%)#37 | 1,204,112(0.00%)#2,903 |
| 38. | Dove Valley | 21 | 10,882(0.19%)#38 | 1,204,112(0.00%)#3,040 |
| 39. | The Pinery | 19 | 10,882(0.17%)#39 | 1,204,112(0.00%)#3,139 |
| 40. | Acres Green | 19 | 10,882(0.17%)#40 | 1,204,112(0.00%)#3,161 |
| 41. | New Castle | 18 | 10,882(0.17%)#41 | 1,204,112(0.00%)#3,227 |
| 42. | Security Widefield | 16 | 10,882(0.15%)#42 | 1,204,112(0.00%)#3,314 |
| 43. | Wheat Ridge | 16 | 10,882(0.15%)#43 | 1,204,112(0.00%)#3,319 |
| 44. | Gunbarrel | 16 | 10,882(0.15%)#44 | 1,204,112(0.00%)#3,341 |
| 45. | Grand Junction | 15 | 10,882(0.14%)#45 | 1,204,112(0.00%)#3,394 |
| 46. | Twin Lakes Cdp Adams County | 15 | 10,882(0.14%)#46 | 1,204,112(0.00%)#3,433 |
| 47. | Basalt | 15 | 10,882(0.14%)#47 | 1,204,112(0.00%)#3,448 |
| 48. | Golden | 13 | 10,882(0.12%)#48 | 1,204,112(0.00%)#3,546 |
| 49. | Sterling Ranch | 12 | 10,882(0.11%)#49 | 1,204,112(0.00%)#3,683 |
| 50. | Sheridan | 11 | 10,882(0.10%)#50 | 1,204,112(0.00%)#3,741 |
| 51. | Stepping Stone | 10 | 10,882(0.09%)#51 | 1,204,112(0.00%)#3,850 |
| 52. | Idaho Springs | 10 | 10,882(0.09%)#52 | 1,204,112(0.00%)#3,856 |
| 53. | Fairmount | 9 | 10,882(0.08%)#53 | 1,204,112(0.00%)#3,916 |
| 54. | Columbine | 8 | 10,882(0.07%)#54 | 1,204,112(0.00%)#3,988 |
| 55. | Woodland Park | 7 | 10,882(0.06%)#55 | 1,204,112(0.00%)#4,114 |
| 56. | Eldorado Springs | 7 | 10,882(0.06%)#56 | 1,204,112(0.00%)#4,159 |
| 57. | Loghill Village | 6 | 10,882(0.06%)#57 | 1,204,112(0.00%)#4,245 |
| 58. | Pueblo West | 4 | 10,882(0.04%)#58 | 1,204,112(0.00%)#4,347 |
| 59. | Canon City | 3 | 10,882(0.03%)#59 | 1,204,112(0.00%)#4,431 |
| 60. | Columbine Valley | 3 | 10,882(0.03%)#60 | 1,204,112(0.00%)#4,456 |
| 61. | Victor | 3 | 10,882(0.03%)#61 | 1,204,112(0.00%)#4,507 |
| 62. | Calhan | 2 | 10,882(0.02%)#62 | 1,204,112(0.00%)#4,582 |
Common Questions
What are the Top 10 Cities with the Most Immigrants from Western Asia in Colorado?
Top 10 Cities with the Most Immigrants from Western Asia in Colorado are:
#1
2,573
#2
1,637
#3
757
#4
610
#5
581
#6
342
#7
338
#8
289
#9
201
#10
181
What city has the Most Immigrants from Western Asia in Colorado?
Denver has the Most Immigrants from Western Asia in Colorado with 2,573.
What is the Total Immigrants from Western Asia in the State of Colorado?
Total Immigrants from Western Asia in Colorado is 10,882.
What is the Total Immigrants from Western Asia in the United States?
Total Immigrants from Western Asia in the United States is 1,204,112.