Cities with the Most Immigrants from Western Asia in Kentucky
RELATED REPORTS & OPTIONS
Western Asia
Kentucky
Compare Cities
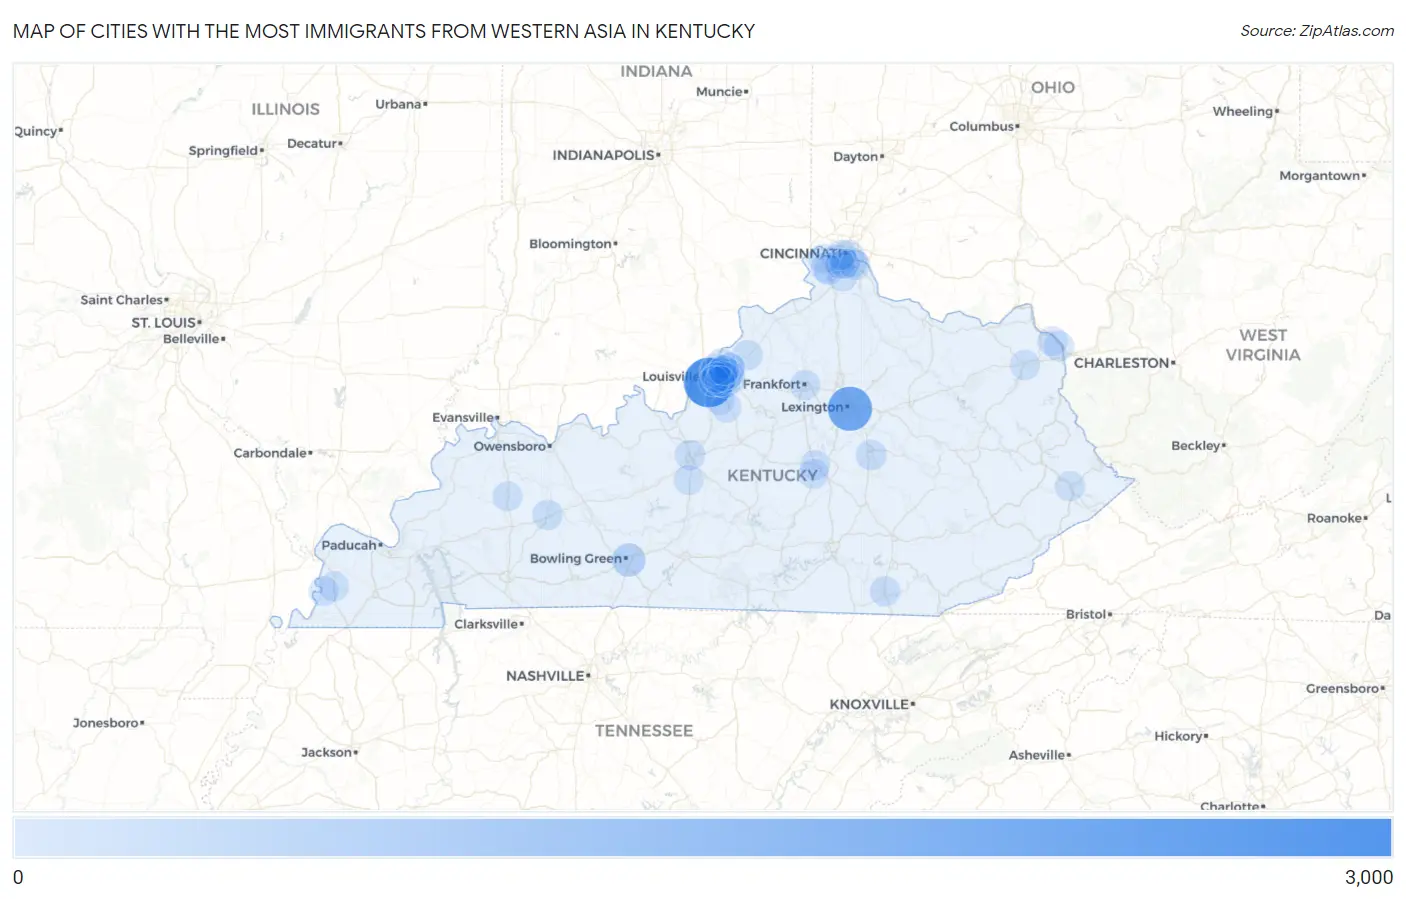
Map of Cities with the Most Immigrants from Western Asia in Kentucky
0
3,000
Cities with the Most Immigrants from Western Asia in Kentucky
| City | Western Asia | vs State | vs National | |
| 1. | Louisville | 2,531 | 6,162(41.07%)#1 | 1,204,112(0.21%)#46 |
| 2. | Lexington | 1,820 | 6,162(29.54%)#2 | 1,204,112(0.15%)#68 |
| 3. | Bowling Green | 405 | 6,162(6.57%)#3 | 1,204,112(0.03%)#429 |
| 4. | Middletown | 87 | 6,162(1.41%)#4 | 1,204,112(0.01%)#1,510 |
| 5. | Richmond | 71 | 6,162(1.15%)#5 | 1,204,112(0.01%)#1,696 |
| 6. | Elizabethtown | 49 | 6,162(0.80%)#6 | 1,204,112(0.00%)#2,076 |
| 7. | Hurstbourne | 47 | 6,162(0.76%)#7 | 1,204,112(0.00%)#2,137 |
| 8. | Independence | 46 | 6,162(0.75%)#8 | 1,204,112(0.00%)#2,149 |
| 9. | Newport | 45 | 6,162(0.73%)#9 | 1,204,112(0.00%)#2,176 |
| 10. | Crescent Springs | 40 | 6,162(0.65%)#10 | 1,204,112(0.00%)#2,302 |
| 11. | Ashland | 38 | 6,162(0.62%)#11 | 1,204,112(0.00%)#2,336 |
| 12. | St Matthews | 36 | 6,162(0.58%)#12 | 1,204,112(0.00%)#2,395 |
| 13. | Jeffersontown | 33 | 6,162(0.54%)#13 | 1,204,112(0.00%)#2,481 |
| 14. | Lyndon | 32 | 6,162(0.52%)#14 | 1,204,112(0.00%)#2,529 |
| 15. | La Grange | 32 | 6,162(0.52%)#15 | 1,204,112(0.00%)#2,530 |
| 16. | Highland Heights | 30 | 6,162(0.49%)#16 | 1,204,112(0.00%)#2,600 |
| 17. | Oakbrook | 27 | 6,162(0.44%)#17 | 1,204,112(0.00%)#2,732 |
| 18. | Danville | 26 | 6,162(0.42%)#18 | 1,204,112(0.00%)#2,766 |
| 19. | Worthington Hills | 26 | 6,162(0.42%)#19 | 1,204,112(0.00%)#2,796 |
| 20. | Frankfort | 25 | 6,162(0.41%)#20 | 1,204,112(0.00%)#2,807 |
| 21. | Central City | 24 | 6,162(0.39%)#21 | 1,204,112(0.00%)#2,877 |
| 22. | Hurstbourne Acres | 23 | 6,162(0.37%)#22 | 1,204,112(0.00%)#2,948 |
| 23. | Williamsburg | 22 | 6,162(0.36%)#23 | 1,204,112(0.00%)#2,987 |
| 24. | Hebron | 20 | 6,162(0.32%)#24 | 1,204,112(0.00%)#3,089 |
| 25. | Florence | 18 | 6,162(0.29%)#25 | 1,204,112(0.00%)#3,177 |
| 26. | Cold Spring | 18 | 6,162(0.29%)#26 | 1,204,112(0.00%)#3,209 |
| 27. | Plantation | 16 | 6,162(0.26%)#27 | 1,204,112(0.00%)#3,388 |
| 28. | Ludlow | 15 | 6,162(0.24%)#28 | 1,204,112(0.00%)#3,443 |
| 29. | Indian Hills | 14 | 6,162(0.23%)#29 | 1,204,112(0.00%)#3,528 |
| 30. | Pikeville | 11 | 6,162(0.18%)#30 | 1,204,112(0.00%)#3,735 |
| 31. | Mount Washington | 9 | 6,162(0.15%)#31 | 1,204,112(0.00%)#3,899 |
| 32. | Langdon Place | 8 | 6,162(0.13%)#32 | 1,204,112(0.00%)#4,070 |
| 33. | Crestview Hills | 7 | 6,162(0.11%)#33 | 1,204,112(0.00%)#4,134 |
| 34. | Junction City | 7 | 6,162(0.11%)#34 | 1,204,112(0.00%)#4,144 |
| 35. | Coldstream | 7 | 6,162(0.11%)#35 | 1,204,112(0.00%)#4,150 |
| 36. | Arlington | 7 | 6,162(0.11%)#36 | 1,204,112(0.00%)#4,160 |
| 37. | Prospect | 6 | 6,162(0.10%)#37 | 1,204,112(0.00%)#4,210 |
| 38. | Bellefonte | 6 | 6,162(0.10%)#38 | 1,204,112(0.00%)#4,238 |
| 39. | Covington | 5 | 6,162(0.08%)#39 | 1,204,112(0.00%)#4,260 |
| 40. | Columbus | 5 | 6,162(0.08%)#40 | 1,204,112(0.00%)#4,342 |
| 41. | Grayson | 4 | 6,162(0.06%)#41 | 1,204,112(0.00%)#4,363 |
| 42. | Blue Ridge Manor | 4 | 6,162(0.06%)#42 | 1,204,112(0.00%)#4,403 |
| 43. | Anchorage | 3 | 6,162(0.05%)#43 | 1,204,112(0.00%)#4,451 |
| 44. | Heritage Creek | 3 | 6,162(0.05%)#44 | 1,204,112(0.00%)#4,483 |
| 45. | Bellemeade | 3 | 6,162(0.05%)#45 | 1,204,112(0.00%)#4,488 |
| 46. | Hanson | 2 | 6,162(0.03%)#46 | 1,204,112(0.00%)#4,554 |
| 47. | Sonora | 2 | 6,162(0.03%)#47 | 1,204,112(0.00%)#4,565 |
| 48. | Glenview | 2 | 6,162(0.03%)#48 | 1,204,112(0.00%)#4,574 |
| 49. | Norbourne Estates | 1 | 6,162(0.02%)#49 | 1,204,112(0.00%)#4,634 |
| 50. | Kingsley | 1 | 6,162(0.02%)#50 | 1,204,112(0.00%)#4,639 |
| 51. | Manor Creek | 1 | 6,162(0.02%)#51 | 1,204,112(0.00%)#4,643 |
| 52. | Lincolnshire | 1 | 6,162(0.02%)#52 | 1,204,112(0.00%)#4,654 |
Common Questions
What are the Top 10 Cities with the Most Immigrants from Western Asia in Kentucky?
Top 10 Cities with the Most Immigrants from Western Asia in Kentucky are:
#1
2,531
#2
1,820
#3
405
#4
87
#5
71
#6
49
#7
47
#8
46
#9
45
#10
40
What city has the Most Immigrants from Western Asia in Kentucky?
Louisville has the Most Immigrants from Western Asia in Kentucky with 2,531.
What is the Total Immigrants from Western Asia in the State of Kentucky?
Total Immigrants from Western Asia in Kentucky is 6,162.
What is the Total Immigrants from Western Asia in the United States?
Total Immigrants from Western Asia in the United States is 1,204,112.