Cities with the Most Immigrants from Western Asia in Illinois
RELATED REPORTS & OPTIONS
Western Asia
Illinois
Compare Cities
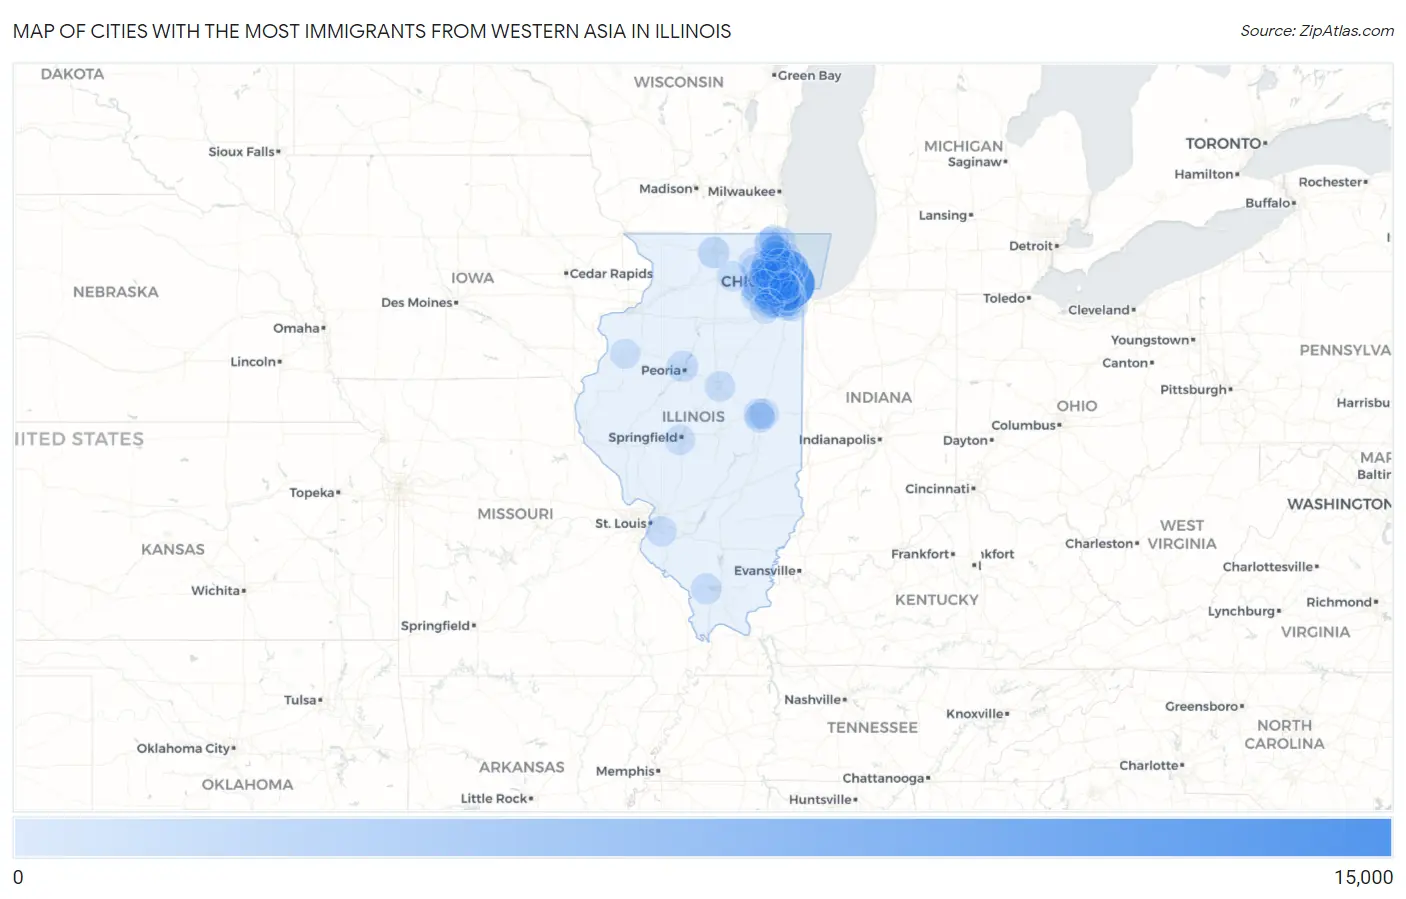
Map of Cities with the Most Immigrants from Western Asia in Illinois
0
15,000
Cities with the Most Immigrants from Western Asia in Illinois
| City | Western Asia | vs State | vs National | |
| 1. | Chicago | 12,346 | 51,369(24.03%)#1 | 1,204,112(1.03%)#8 |
| 2. | Skokie | 4,139 | 51,369(8.06%)#2 | 1,204,112(0.34%)#24 |
| 3. | Niles | 1,332 | 51,369(2.59%)#3 | 1,204,112(0.11%)#97 |
| 4. | Orland Park | 1,118 | 51,369(2.18%)#4 | 1,204,112(0.09%)#127 |
| 5. | Oak Lawn | 1,075 | 51,369(2.09%)#5 | 1,204,112(0.09%)#134 |
| 6. | Chicago Ridge | 1,060 | 51,369(2.06%)#6 | 1,204,112(0.09%)#137 |
| 7. | Rockford | 944 | 51,369(1.84%)#7 | 1,204,112(0.08%)#158 |
| 8. | Des Plaines | 878 | 51,369(1.71%)#8 | 1,204,112(0.07%)#175 |
| 9. | Mount Prospect | 809 | 51,369(1.57%)#9 | 1,204,112(0.07%)#195 |
| 10. | Hickory Hills | 771 | 51,369(1.50%)#10 | 1,204,112(0.06%)#207 |
| 11. | Lincolnwood | 761 | 51,369(1.48%)#11 | 1,204,112(0.06%)#210 |
| 12. | Morton Grove | 726 | 51,369(1.41%)#12 | 1,204,112(0.06%)#222 |
| 13. | Peoria | 684 | 51,369(1.33%)#13 | 1,204,112(0.06%)#241 |
| 14. | Tinley Park | 684 | 51,369(1.33%)#14 | 1,204,112(0.06%)#242 |
| 15. | Westmont | 623 | 51,369(1.21%)#15 | 1,204,112(0.05%)#269 |
| 16. | Evanston | 580 | 51,369(1.13%)#16 | 1,204,112(0.05%)#292 |
| 17. | Naperville | 550 | 51,369(1.07%)#17 | 1,204,112(0.05%)#304 |
| 18. | Worth | 546 | 51,369(1.06%)#18 | 1,204,112(0.05%)#309 |
| 19. | Aurora | 525 | 51,369(1.02%)#19 | 1,204,112(0.04%)#320 |
| 20. | North Aurora | 510 | 51,369(0.99%)#20 | 1,204,112(0.04%)#328 |
| 21. | Schaumburg | 487 | 51,369(0.95%)#21 | 1,204,112(0.04%)#350 |
| 22. | Burbank | 469 | 51,369(0.91%)#22 | 1,204,112(0.04%)#363 |
| 23. | Bridgeview | 466 | 51,369(0.91%)#23 | 1,204,112(0.04%)#368 |
| 24. | Palos Hills | 428 | 51,369(0.83%)#24 | 1,204,112(0.04%)#408 |
| 25. | Carbondale | 402 | 51,369(0.78%)#25 | 1,204,112(0.03%)#433 |
| 26. | Justice | 393 | 51,369(0.77%)#26 | 1,204,112(0.03%)#444 |
| 27. | Hoffman Estates | 390 | 51,369(0.76%)#27 | 1,204,112(0.03%)#449 |
| 28. | Champaign | 374 | 51,369(0.73%)#28 | 1,204,112(0.03%)#462 |
| 29. | Homer Glen | 360 | 51,369(0.70%)#29 | 1,204,112(0.03%)#486 |
| 30. | Glenview | 357 | 51,369(0.69%)#30 | 1,204,112(0.03%)#491 |
| 31. | Lockport | 356 | 51,369(0.69%)#31 | 1,204,112(0.03%)#492 |
| 32. | Wheaton | 339 | 51,369(0.66%)#32 | 1,204,112(0.03%)#515 |
| 33. | Northbrook | 328 | 51,369(0.64%)#33 | 1,204,112(0.03%)#529 |
| 34. | Roselle | 328 | 51,369(0.64%)#34 | 1,204,112(0.03%)#530 |
| 35. | Bloomington | 323 | 51,369(0.63%)#35 | 1,204,112(0.03%)#535 |
| 36. | Buffalo Grove | 317 | 51,369(0.62%)#36 | 1,204,112(0.03%)#547 |
| 37. | Wheeling | 291 | 51,369(0.57%)#37 | 1,204,112(0.02%)#592 |
| 38. | Norridge | 291 | 51,369(0.57%)#38 | 1,204,112(0.02%)#593 |
| 39. | Belleville | 276 | 51,369(0.54%)#39 | 1,204,112(0.02%)#632 |
| 40. | Park Ridge | 249 | 51,369(0.48%)#40 | 1,204,112(0.02%)#698 |
| 41. | Orland Hills | 248 | 51,369(0.48%)#41 | 1,204,112(0.02%)#703 |
| 42. | Clarendon Hills | 235 | 51,369(0.46%)#42 | 1,204,112(0.02%)#738 |
| 43. | Springfield | 229 | 51,369(0.45%)#43 | 1,204,112(0.02%)#751 |
| 44. | Gilberts | 229 | 51,369(0.45%)#44 | 1,204,112(0.02%)#754 |
| 45. | Burr Ridge | 218 | 51,369(0.42%)#45 | 1,204,112(0.02%)#784 |
| 46. | Flossmoor | 218 | 51,369(0.42%)#46 | 1,204,112(0.02%)#785 |
| 47. | Palatine | 207 | 51,369(0.40%)#47 | 1,204,112(0.02%)#815 |
| 48. | Vernon Hills | 206 | 51,369(0.40%)#48 | 1,204,112(0.02%)#819 |
| 49. | Urbana | 199 | 51,369(0.39%)#49 | 1,204,112(0.02%)#843 |
| 50. | Arlington Heights | 198 | 51,369(0.39%)#50 | 1,204,112(0.02%)#846 |
| 51. | Mundelein | 194 | 51,369(0.38%)#51 | 1,204,112(0.02%)#858 |
| 52. | Elgin | 190 | 51,369(0.37%)#52 | 1,204,112(0.02%)#869 |
| 53. | Savoy | 190 | 51,369(0.37%)#53 | 1,204,112(0.02%)#872 |
| 54. | Oak Brook | 185 | 51,369(0.36%)#54 | 1,204,112(0.02%)#890 |
| 55. | Dekalb | 184 | 51,369(0.36%)#55 | 1,204,112(0.02%)#892 |
| 56. | Schiller Park | 181 | 51,369(0.35%)#56 | 1,204,112(0.02%)#908 |
| 57. | Oak Park | 178 | 51,369(0.35%)#57 | 1,204,112(0.01%)#913 |
| 58. | Waukegan | 175 | 51,369(0.34%)#58 | 1,204,112(0.01%)#926 |
| 59. | Oak Forest | 169 | 51,369(0.33%)#59 | 1,204,112(0.01%)#945 |
| 60. | Streamwood | 166 | 51,369(0.32%)#60 | 1,204,112(0.01%)#958 |
| 61. | Palos Heights | 163 | 51,369(0.32%)#61 | 1,204,112(0.01%)#982 |
| 62. | Wilmette | 161 | 51,369(0.31%)#62 | 1,204,112(0.01%)#992 |
| 63. | Glen Ellyn | 159 | 51,369(0.31%)#63 | 1,204,112(0.01%)#1,001 |
| 64. | Downers Grove | 147 | 51,369(0.29%)#64 | 1,204,112(0.01%)#1,052 |
| 65. | Elmhurst | 146 | 51,369(0.28%)#65 | 1,204,112(0.01%)#1,055 |
| 66. | Oswego | 146 | 51,369(0.28%)#66 | 1,204,112(0.01%)#1,057 |
| 67. | Bolingbrook | 139 | 51,369(0.27%)#67 | 1,204,112(0.01%)#1,090 |
| 68. | Woodridge | 138 | 51,369(0.27%)#68 | 1,204,112(0.01%)#1,097 |
| 69. | Highland Park | 137 | 51,369(0.27%)#69 | 1,204,112(0.01%)#1,107 |
| 70. | Rolling Meadows | 135 | 51,369(0.26%)#70 | 1,204,112(0.01%)#1,122 |
| 71. | Rosemont | 135 | 51,369(0.26%)#71 | 1,204,112(0.01%)#1,126 |
| 72. | Romeoville | 132 | 51,369(0.26%)#72 | 1,204,112(0.01%)#1,143 |
| 73. | Westchester | 131 | 51,369(0.26%)#73 | 1,204,112(0.01%)#1,151 |
| 74. | Carol Stream | 129 | 51,369(0.25%)#74 | 1,204,112(0.01%)#1,160 |
| 75. | Cicero | 125 | 51,369(0.24%)#75 | 1,204,112(0.01%)#1,192 |
| 76. | Darien | 124 | 51,369(0.24%)#76 | 1,204,112(0.01%)#1,200 |
| 77. | Elk Grove Village | 116 | 51,369(0.23%)#77 | 1,204,112(0.01%)#1,253 |
| 78. | Hanover Park | 115 | 51,369(0.22%)#78 | 1,204,112(0.01%)#1,258 |
| 79. | Libertyville | 111 | 51,369(0.22%)#79 | 1,204,112(0.01%)#1,299 |
| 80. | Wood Dale | 110 | 51,369(0.21%)#80 | 1,204,112(0.01%)#1,305 |
| 81. | Franklin Park | 109 | 51,369(0.21%)#81 | 1,204,112(0.01%)#1,313 |
| 82. | Hinsdale | 106 | 51,369(0.21%)#82 | 1,204,112(0.01%)#1,343 |
| 83. | Addison | 95 | 51,369(0.18%)#83 | 1,204,112(0.01%)#1,419 |
| 84. | Bloomingdale | 91 | 51,369(0.18%)#84 | 1,204,112(0.01%)#1,456 |
| 85. | Alsip | 91 | 51,369(0.18%)#85 | 1,204,112(0.01%)#1,457 |
| 86. | South Barrington | 90 | 51,369(0.18%)#86 | 1,204,112(0.01%)#1,479 |
| 87. | Batavia | 83 | 51,369(0.16%)#87 | 1,204,112(0.01%)#1,546 |
| 88. | Lyons | 83 | 51,369(0.16%)#88 | 1,204,112(0.01%)#1,551 |
| 89. | Bartlett | 81 | 51,369(0.16%)#89 | 1,204,112(0.01%)#1,569 |
| 90. | Round Lake Beach | 75 | 51,369(0.15%)#90 | 1,204,112(0.01%)#1,648 |
| 91. | Long Grove | 75 | 51,369(0.15%)#91 | 1,204,112(0.01%)#1,656 |
| 92. | Brookfield | 73 | 51,369(0.14%)#92 | 1,204,112(0.01%)#1,676 |
| 93. | Monmouth | 71 | 51,369(0.14%)#93 | 1,204,112(0.01%)#1,706 |
| 94. | Round Lake | 68 | 51,369(0.13%)#94 | 1,204,112(0.01%)#1,739 |
| 95. | Summit | 67 | 51,369(0.13%)#95 | 1,204,112(0.01%)#1,756 |
| 96. | Lindenhurst | 66 | 51,369(0.13%)#96 | 1,204,112(0.01%)#1,770 |
| 97. | Warrenville | 66 | 51,369(0.13%)#97 | 1,204,112(0.01%)#1,771 |
| 98. | Crest Hill | 65 | 51,369(0.13%)#98 | 1,204,112(0.01%)#1,787 |
| 99. | Prospect Heights | 64 | 51,369(0.12%)#99 | 1,204,112(0.01%)#1,812 |
| 100. | Joliet | 63 | 51,369(0.12%)#100 | 1,204,112(0.01%)#1,820 |
Common Questions
What are the Top 10 Cities with the Most Immigrants from Western Asia in Illinois?
Top 10 Cities with the Most Immigrants from Western Asia in Illinois are:
#1
12,346
#2
4,139
#3
1,332
#4
1,118
#5
1,075
#6
1,060
#7
944
#8
878
#9
809
#10
771
What city has the Most Immigrants from Western Asia in Illinois?
Chicago has the Most Immigrants from Western Asia in Illinois with 12,346.
What is the Total Immigrants from Western Asia in the State of Illinois?
Total Immigrants from Western Asia in Illinois is 51,369.
What is the Total Immigrants from Western Asia in the United States?
Total Immigrants from Western Asia in the United States is 1,204,112.