Zip Codes with the Lowest Percentage of Renter-Occupied Units in Paterson, NJ
RELATED REPORTS & OPTIONS
Lowest Renter-Occupied
Paterson
Compare Zip Codes
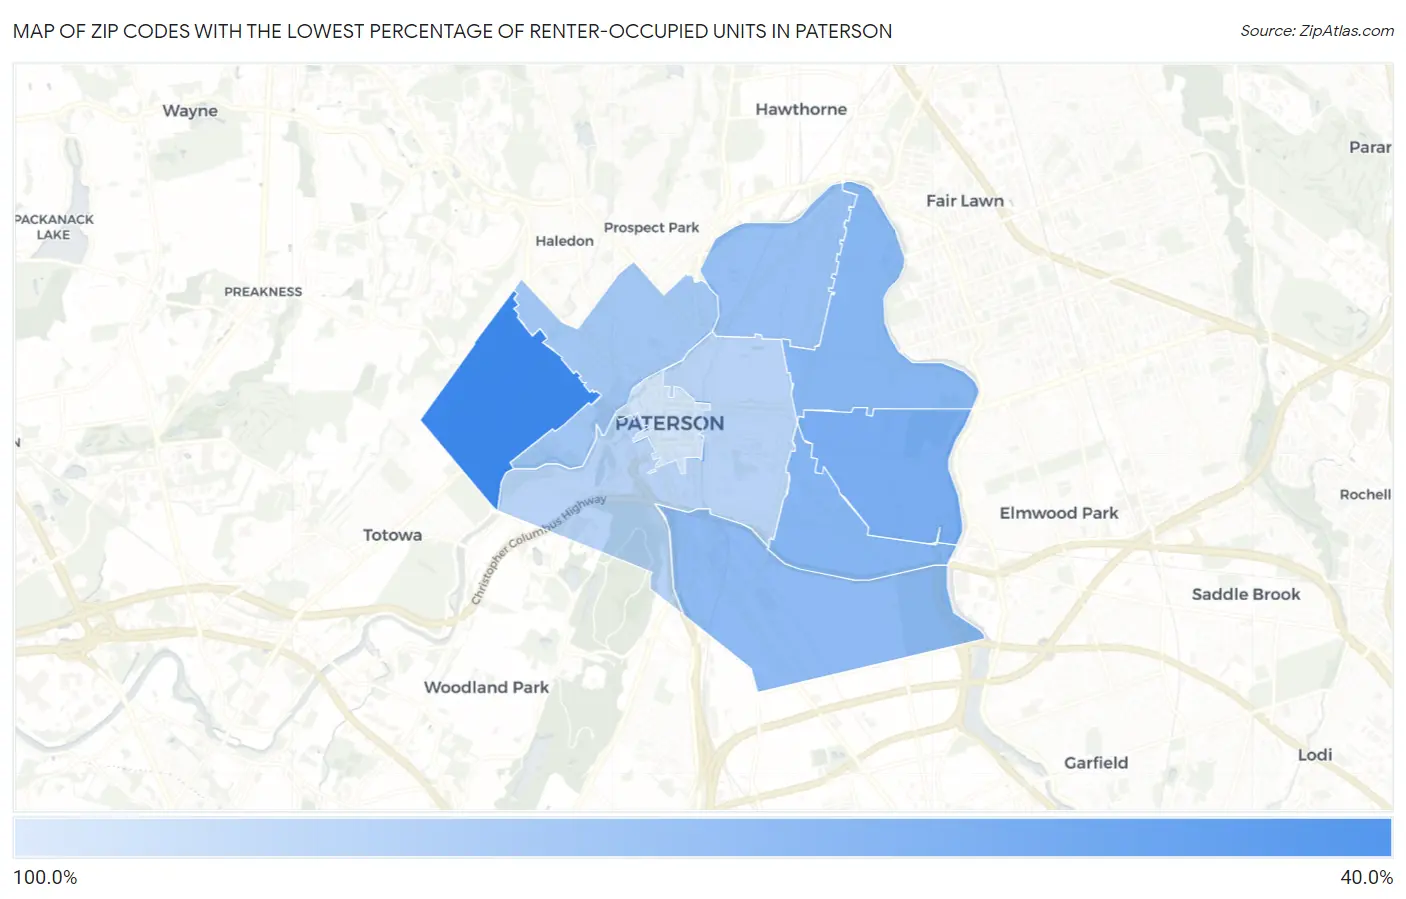
Map of Zip Codes with the Lowest Percentage of Renter-Occupied Units in Paterson
96.5%
44.6%
Zip Codes with the Lowest Percentage of Renter-Occupied Units in Paterson, NJ
| Zip Code | % Renter-Occupied | vs State | vs National | |
| 1. | 07502 | 44.6% | 36.1%(+8.48)#440 | 35.2%(+9.43)#26,941 |
| 2. | 07504 | 64.2% | 36.1%(+28.0)#507 | 35.2%(+29.0)#29,658 |
| 3. | 07513 | 68.4% | 36.1%(+32.2)#516 | 35.2%(+33.2)#29,950 |
| 4. | 07514 | 69.0% | 36.1%(+32.9)#518 | 35.2%(+33.8)#29,983 |
| 5. | 07503 | 71.2% | 36.1%(+35.0)#523 | 35.2%(+36.0)#30,100 |
| 6. | 07524 | 74.9% | 36.1%(+38.8)#530 | 35.2%(+39.8)#30,262 |
| 7. | 07522 | 79.0% | 36.1%(+42.9)#542 | 35.2%(+43.8)#30,401 |
| 8. | 07501 | 86.5% | 36.1%(+50.3)#549 | 35.2%(+51.3)#30,574 |
| 9. | 07505 | 96.5% | 36.1%(+60.4)#553 | 35.2%(+61.3)#30,736 |
1
Common Questions
What are the Top 5 Zip Codes with the Lowest Percentage of Renter-Occupied Units in Paterson, NJ?
Top 5 Zip Codes with the Lowest Percentage of Renter-Occupied Units in Paterson, NJ are:
What zip code has the Lowest Percentage of Renter-Occupied Units in Paterson, NJ?
07502 has the Lowest Percentage of Renter-Occupied Units in Paterson, NJ with 44.6%.
What is the Percentage of Renter-Occupied Units in Paterson, NJ?
Percentage of Renter-Occupied Units in Paterson is 73.7%.
What is the Percentage of Renter-Occupied Units in New Jersey?
Percentage of Renter-Occupied Units in New Jersey is 36.1%.
What is the Percentage of Renter-Occupied Units in the United States?
Percentage of Renter-Occupied Units in the United States is 35.2%.