Cities with the Highest Percentage of Immigrants from Taiwan in New York
RELATED REPORTS & OPTIONS
Taiwan
New York
Compare Cities
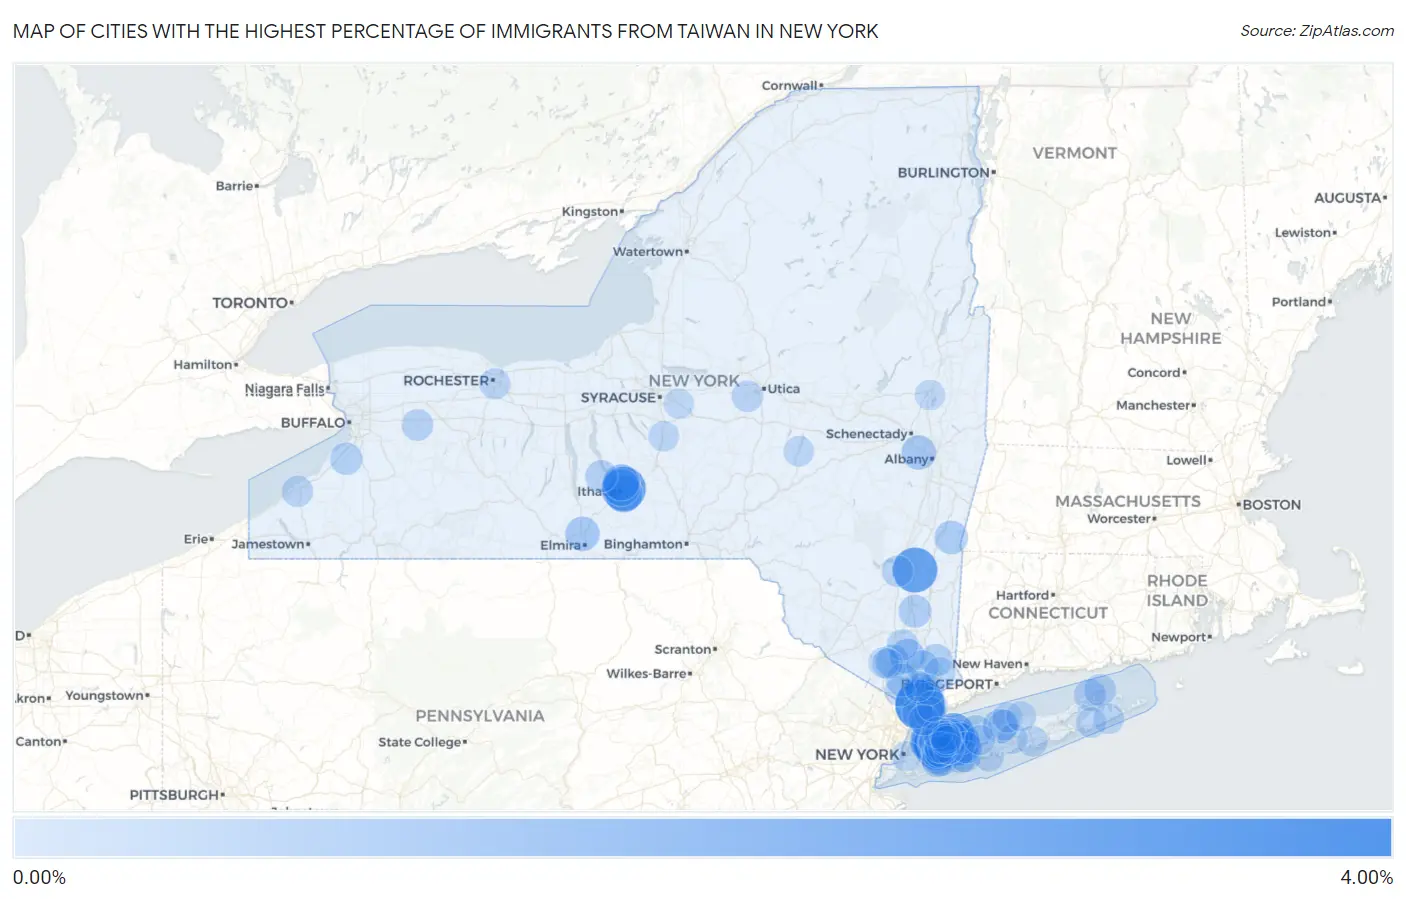
Map of Cities with the Highest Percentage of Immigrants from Taiwan in New York
0.00%
4.00%
Cities with the Highest Percentage of Immigrants from Taiwan in New York
| City | Taiwan | vs State | vs National | |
| 1. | Irvington | 3.17% | 0.15%(+3.02)#1 | 0.11%(+3.06)#34 |
| 2. | Lake Success | 2.76% | 0.15%(+2.61)#2 | 0.11%(+2.65)#46 |
| 3. | Jericho | 2.67% | 0.15%(+2.51)#3 | 0.11%(+2.55)#52 |
| 4. | Rhinebeck | 2.45% | 0.15%(+2.30)#4 | 0.11%(+2.34)#60 |
| 5. | Saddle Rock | 2.40% | 0.15%(+2.25)#5 | 0.11%(+2.29)#63 |
| 6. | Forest Home | 2.35% | 0.15%(+2.20)#6 | 0.11%(+2.24)#67 |
| 7. | Great Neck Estates | 2.28% | 0.15%(+2.13)#7 | 0.11%(+2.17)#74 |
| 8. | Russell Gardens | 2.09% | 0.15%(+1.94)#8 | 0.11%(+1.98)#88 |
| 9. | North Hills | 2.06% | 0.15%(+1.91)#9 | 0.11%(+1.95)#90 |
| 10. | Roslyn Heights | 2.04% | 0.15%(+1.89)#10 | 0.11%(+1.93)#91 |
| 11. | Upper Brookville | 1.91% | 0.15%(+1.76)#11 | 0.11%(+1.80)#102 |
| 12. | Greenville Cdp Westchester County | 1.72% | 0.15%(+1.57)#12 | 0.11%(+1.61)#119 |
| 13. | Garden City Park | 1.59% | 0.15%(+1.44)#13 | 0.11%(+1.48)#130 |
| 14. | Albertson | 1.57% | 0.15%(+1.42)#14 | 0.11%(+1.46)#132 |
| 15. | Kensington | 1.31% | 0.15%(+1.16)#15 | 0.11%(+1.20)#162 |
| 16. | East Ithaca | 1.31% | 0.15%(+1.16)#16 | 0.11%(+1.20)#163 |
| 17. | Cayuga Heights | 1.26% | 0.15%(+1.11)#17 | 0.11%(+1.15)#172 |
| 18. | Lansing | 1.15% | 0.15%(+1.00)#18 | 0.11%(+1.04)#191 |
| 19. | North New Hyde Park | 1.11% | 0.15%(+0.959)#19 | 0.11%(+0.999)#202 |
| 20. | Port Washington North | 1.07% | 0.15%(+0.920)#20 | 0.11%(+0.959)#215 |
| 21. | Highland Falls | 0.89% | 0.15%(+0.734)#21 | 0.11%(+0.773)#282 |
| 22. | Westmere | 0.87% | 0.15%(+0.719)#22 | 0.11%(+0.758)#289 |
| 23. | Head Of The Harbor | 0.87% | 0.15%(+0.713)#23 | 0.11%(+0.752)#293 |
| 24. | Horseheads | 0.86% | 0.15%(+0.705)#24 | 0.11%(+0.745)#296 |
| 25. | Thomaston | 0.80% | 0.15%(+0.647)#25 | 0.11%(+0.686)#319 |
| 26. | University Gardens | 0.79% | 0.15%(+0.638)#26 | 0.11%(+0.678)#328 |
| 27. | Plandome Heights | 0.75% | 0.15%(+0.593)#27 | 0.11%(+0.633)#352 |
| 28. | Copake Lake | 0.73% | 0.15%(+0.581)#28 | 0.11%(+0.621)#358 |
| 29. | North Wantagh | 0.71% | 0.15%(+0.555)#29 | 0.11%(+0.594)#370 |
| 30. | North Valley Stream | 0.70% | 0.15%(+0.552)#30 | 0.11%(+0.591)#375 |
| 31. | Woodbury | 0.69% | 0.15%(+0.533)#31 | 0.11%(+0.572)#383 |
| 32. | Muttontown | 0.69% | 0.15%(+0.533)#32 | 0.11%(+0.572)#384 |
| 33. | Roslyn | 0.68% | 0.15%(+0.530)#33 | 0.11%(+0.569)#386 |
| 34. | Thiells | 0.62% | 0.15%(+0.470)#34 | 0.11%(+0.510)#435 |
| 35. | Spackenkill | 0.62% | 0.15%(+0.470)#35 | 0.11%(+0.509)#436 |
| 36. | Mineola | 0.62% | 0.15%(+0.463)#36 | 0.11%(+0.502)#441 |
| 37. | Manhasset | 0.60% | 0.15%(+0.443)#37 | 0.11%(+0.482)#451 |
| 38. | Greenlawn | 0.59% | 0.15%(+0.440)#38 | 0.11%(+0.480)#455 |
| 39. | Setauket | 0.59% | 0.15%(+0.435)#39 | 0.11%(+0.475)#460 |
| 40. | Great Neck | 0.59% | 0.15%(+0.435)#40 | 0.11%(+0.474)#462 |
| 41. | Lincolndale | 0.58% | 0.15%(+0.422)#41 | 0.11%(+0.462)#477 |
| 42. | Eden | 0.57% | 0.15%(+0.417)#42 | 0.11%(+0.456)#481 |
| 43. | Flower Hill | 0.56% | 0.15%(+0.411)#43 | 0.11%(+0.450)#488 |
| 44. | Syosset | 0.55% | 0.15%(+0.395)#44 | 0.11%(+0.434)#508 |
| 45. | Crompond | 0.54% | 0.15%(+0.390)#45 | 0.11%(+0.429)#509 |
| 46. | Trumansburg | 0.54% | 0.15%(+0.386)#46 | 0.11%(+0.425)#515 |
| 47. | Malverne | 0.53% | 0.15%(+0.375)#47 | 0.11%(+0.414)#523 |
| 48. | Briarcliff Manor | 0.51% | 0.15%(+0.361)#48 | 0.11%(+0.400)#535 |
| 49. | Latham | 0.51% | 0.15%(+0.359)#49 | 0.11%(+0.399)#539 |
| 50. | Valley Stream | 0.51% | 0.15%(+0.356)#50 | 0.11%(+0.395)#545 |
| 51. | North Massapequa | 0.51% | 0.15%(+0.352)#51 | 0.11%(+0.392)#549 |
| 52. | Brookville | 0.50% | 0.15%(+0.349)#52 | 0.11%(+0.388)#552 |
| 53. | Vassar College | 0.50% | 0.15%(+0.345)#53 | 0.11%(+0.384)#557 |
| 54. | Greenport West | 0.49% | 0.15%(+0.340)#54 | 0.11%(+0.380)#563 |
| 55. | Orient | 0.49% | 0.15%(+0.339)#55 | 0.11%(+0.378)#566 |
| 56. | Tioga Terrace | 0.47% | 0.15%(+0.315)#56 | 0.11%(+0.355)#595 |
| 57. | Attica | 0.47% | 0.15%(+0.315)#57 | 0.11%(+0.355)#596 |
| 58. | Scarsdale | 0.46% | 0.15%(+0.306)#58 | 0.11%(+0.346)#606 |
| 59. | Floral Park | 0.45% | 0.15%(+0.294)#59 | 0.11%(+0.333)#625 |
| 60. | Glen Head | 0.44% | 0.15%(+0.284)#60 | 0.11%(+0.324)#631 |
| 61. | Old Bethpage | 0.43% | 0.15%(+0.279)#61 | 0.11%(+0.319)#635 |
| 62. | Cornwall On Hudson | 0.43% | 0.15%(+0.274)#62 | 0.11%(+0.313)#645 |
| 63. | Williston Park | 0.42% | 0.15%(+0.271)#63 | 0.11%(+0.311)#652 |
| 64. | Hurley | 0.42% | 0.15%(+0.262)#64 | 0.11%(+0.302)#664 |
| 65. | Clinton | 0.41% | 0.15%(+0.262)#65 | 0.11%(+0.301)#666 |
| 66. | Port Washington | 0.41% | 0.15%(+0.258)#66 | 0.11%(+0.298)#673 |
| 67. | Fredonia | 0.40% | 0.15%(+0.249)#67 | 0.11%(+0.288)#685 |
| 68. | New Hyde Park | 0.40% | 0.15%(+0.247)#68 | 0.11%(+0.287)#688 |
| 69. | Akwesasne | 0.38% | 0.15%(+0.228)#69 | 0.11%(+0.268)#720 |
| 70. | Hastings On Hudson | 0.38% | 0.15%(+0.225)#70 | 0.11%(+0.265)#724 |
| 71. | Brighton | 0.37% | 0.15%(+0.222)#71 | 0.11%(+0.261)#732 |
| 72. | Katonah | 0.37% | 0.15%(+0.217)#72 | 0.11%(+0.256)#743 |
| 73. | Glenwood Landing | 0.35% | 0.15%(+0.199)#73 | 0.11%(+0.238)#769 |
| 74. | Carle Place | 0.33% | 0.15%(+0.182)#74 | 0.11%(+0.221)#799 |
| 75. | Sands Point | 0.33% | 0.15%(+0.180)#75 | 0.11%(+0.219)#804 |
| 76. | Manhasset Hills | 0.33% | 0.15%(+0.180)#76 | 0.11%(+0.219)#805 |
| 77. | Monroe | 0.33% | 0.15%(+0.176)#77 | 0.11%(+0.215)#810 |
| 78. | Pleasantville | 0.32% | 0.15%(+0.170)#78 | 0.11%(+0.209)#822 |
| 79. | Bronxville | 0.32% | 0.15%(+0.166)#79 | 0.11%(+0.206)#828 |
| 80. | East Hills | 0.32% | 0.15%(+0.164)#80 | 0.11%(+0.204)#834 |
| 81. | Shirley | 0.32% | 0.15%(+0.164)#81 | 0.11%(+0.203)#835 |
| 82. | East Hampton | 0.31% | 0.15%(+0.162)#82 | 0.11%(+0.201)#838 |
| 83. | West Bay Shore | 0.31% | 0.15%(+0.160)#83 | 0.11%(+0.199)#841 |
| 84. | Hillcrest | 0.31% | 0.15%(+0.153)#84 | 0.11%(+0.192)#861 |
| 85. | Roslyn Harbor | 0.30% | 0.15%(+0.152)#85 | 0.11%(+0.191)#865 |
| 86. | Harriman | 0.30% | 0.15%(+0.151)#86 | 0.11%(+0.191)#867 |
| 87. | Tully | 0.30% | 0.15%(+0.151)#87 | 0.11%(+0.191)#868 |
| 88. | Stony Brook | 0.30% | 0.15%(+0.151)#88 | 0.11%(+0.190)#872 |
| 89. | Water Mill | 0.30% | 0.15%(+0.150)#89 | 0.11%(+0.190)#873 |
| 90. | White Plains | 0.30% | 0.15%(+0.143)#90 | 0.11%(+0.183)#890 |
| 91. | Cooperstown | 0.29% | 0.15%(+0.142)#91 | 0.11%(+0.181)#895 |
| 92. | Holtsville | 0.28% | 0.15%(+0.122)#92 | 0.11%(+0.162)#935 |
| 93. | Poquott | 0.27% | 0.15%(+0.118)#93 | 0.11%(+0.157)#952 |
| 94. | Dix Hills | 0.26% | 0.15%(+0.111)#94 | 0.11%(+0.150)#967 |
| 95. | Gananda | 0.26% | 0.15%(+0.109)#95 | 0.11%(+0.148)#974 |
| 96. | Ossining | 0.26% | 0.15%(+0.105)#96 | 0.11%(+0.145)#983 |
| 97. | Manlius | 0.26% | 0.15%(+0.104)#97 | 0.11%(+0.143)#989 |
| 98. | Saratoga Springs | 0.25% | 0.15%(+0.099)#98 | 0.11%(+0.139)#1,006 |
| 99. | Sound Beach | 0.25% | 0.15%(+0.098)#99 | 0.11%(+0.138)#1,008 |
| 100. | New York | 0.25% | 0.15%(+0.097)#100 | 0.11%(+0.137)#1,013 |
Common Questions
What are the Top 10 Cities with the Highest Percentage of Immigrants from Taiwan in New York?
Top 10 Cities with the Highest Percentage of Immigrants from Taiwan in New York are:
#1
3.17%
#2
2.76%
#3
2.67%
#4
2.45%
#5
2.40%
#6
2.35%
#7
2.28%
#8
2.09%
#9
2.06%
#10
2.04%
What city has the Highest Percentage of Immigrants from Taiwan in New York?
Irvington has the Highest Percentage of Immigrants from Taiwan in New York with 3.17%.
What is the Percentage of Immigrants from Taiwan in the State of New York?
Percentage of Immigrants from Taiwan in New York is 0.15%.
What is the Percentage of Immigrants from Taiwan in the United States?
Percentage of Immigrants from Taiwan in the United States is 0.11%.