Cities with the Highest Percentage of Immigrants from Taiwan in Ohio
RELATED REPORTS & OPTIONS
Taiwan
Ohio
Compare Cities
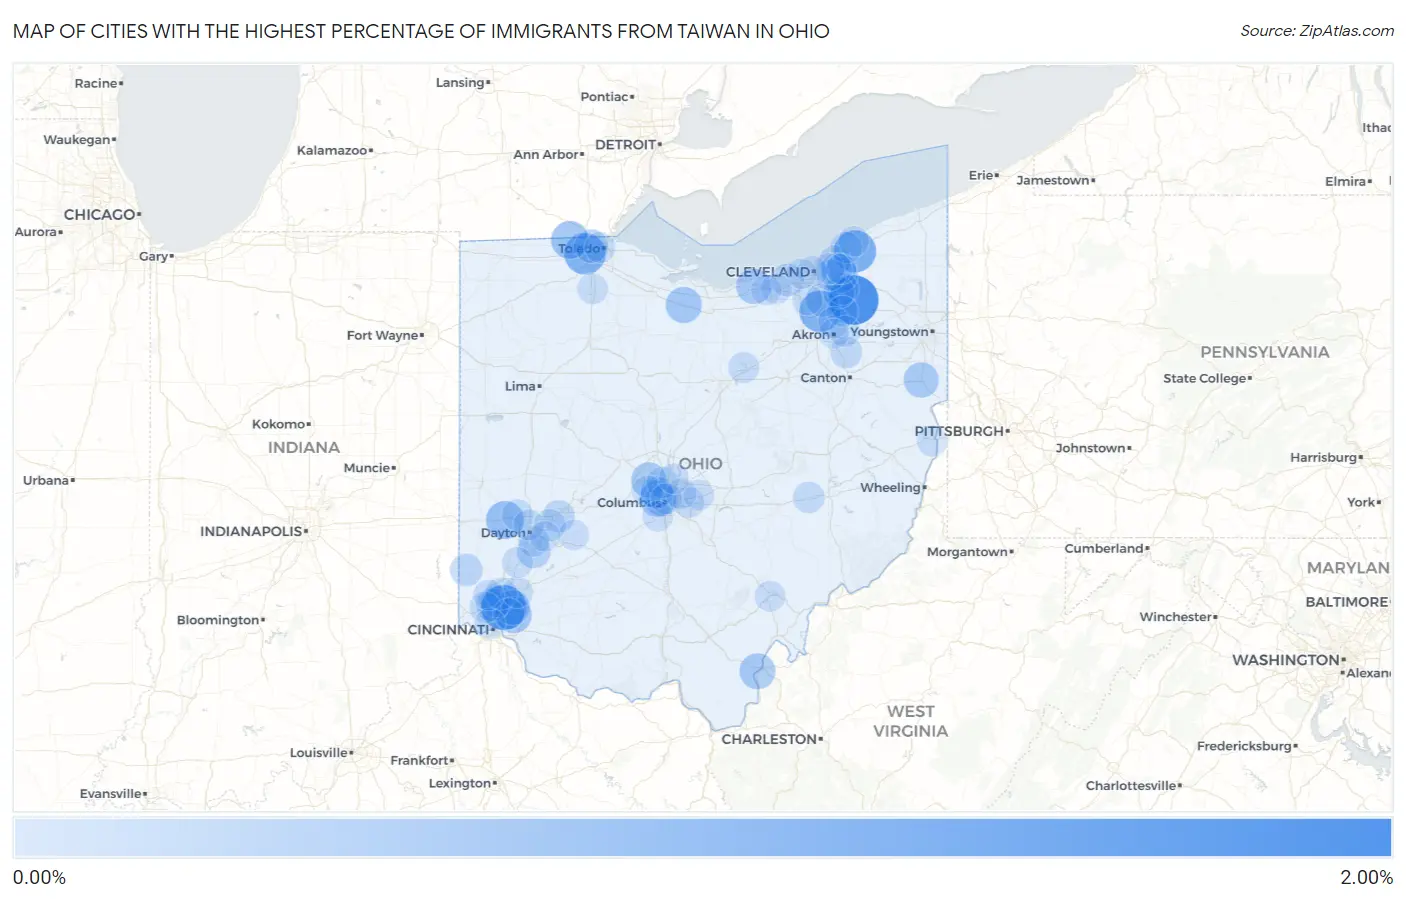
Map of Cities with the Highest Percentage of Immigrants from Taiwan in Ohio
0.00%
2.00%
Cities with the Highest Percentage of Immigrants from Taiwan in Ohio
| City | Taiwan | vs State | vs National | |
| 1. | Aurora | 1.68% | 0.032%(+1.65)#1 | 0.11%(+1.57)#122 |
| 2. | Evendale | 1.28% | 0.032%(+1.25)#2 | 0.11%(+1.16)#168 |
| 3. | Kirtland Hills | 1.03% | 0.032%(+1.00)#3 | 0.11%(+0.919)#224 |
| 4. | Richfield | 0.97% | 0.032%(+0.936)#4 | 0.11%(+0.854)#247 |
| 5. | Holland | 0.96% | 0.032%(+0.929)#5 | 0.11%(+0.847)#252 |
| 6. | Brookville | 0.66% | 0.032%(+0.631)#6 | 0.11%(+0.549)#401 |
| 7. | Berkey | 0.65% | 0.032%(+0.614)#7 | 0.11%(+0.531)#422 |
| 8. | The Village Of Indian Hill | 0.51% | 0.032%(+0.481)#8 | 0.11%(+0.399)#540 |
| 9. | Bellevue | 0.51% | 0.032%(+0.480)#9 | 0.11%(+0.398)#542 |
| 10. | Marble Cliff | 0.50% | 0.032%(+0.464)#10 | 0.11%(+0.382)#558 |
| 11. | Gallipolis | 0.48% | 0.032%(+0.448)#11 | 0.11%(+0.366)#578 |
| 12. | Pepper Pike | 0.47% | 0.032%(+0.441)#12 | 0.11%(+0.358)#590 |
| 13. | Amherst | 0.45% | 0.032%(+0.416)#13 | 0.11%(+0.334)#623 |
| 14. | Dublin | 0.43% | 0.032%(+0.400)#14 | 0.11%(+0.318)#637 |
| 15. | Lisbon | 0.43% | 0.032%(+0.394)#15 | 0.11%(+0.312)#649 |
| 16. | Montgomery | 0.40% | 0.032%(+0.366)#16 | 0.11%(+0.284)#692 |
| 17. | Centerville | 0.29% | 0.032%(+0.262)#17 | 0.11%(+0.180)#900 |
| 18. | Ottawa Hills | 0.27% | 0.032%(+0.240)#18 | 0.11%(+0.158)#949 |
| 19. | Brecksville | 0.27% | 0.032%(+0.240)#19 | 0.11%(+0.158)#951 |
| 20. | Greenhills | 0.22% | 0.032%(+0.184)#20 | 0.11%(+0.102)#1,111 |
| 21. | Westlake | 0.21% | 0.032%(+0.183)#21 | 0.11%(+0.101)#1,114 |
| 22. | Oxford | 0.20% | 0.032%(+0.163)#22 | 0.11%(+0.081)#1,178 |
| 23. | Grandview Heights | 0.19% | 0.032%(+0.162)#23 | 0.11%(+0.080)#1,185 |
| 24. | Upper Arlington | 0.18% | 0.032%(+0.152)#24 | 0.11%(+0.070)#1,233 |
| 25. | Enon | 0.16% | 0.032%(+0.128)#25 | 0.11%(+0.046)#1,335 |
| 26. | Solon | 0.15% | 0.032%(+0.114)#26 | 0.11%(+0.032)#1,414 |
| 27. | Springdale | 0.14% | 0.032%(+0.105)#27 | 0.11%(+0.023)#1,460 |
| 28. | Richmond Heights | 0.13% | 0.032%(+0.099)#28 | 0.11%(+0.017)#1,495 |
| 29. | Uniontown | 0.13% | 0.032%(+0.098)#29 | 0.11%(+0.016)#1,501 |
| 30. | Fairborn | 0.12% | 0.032%(+0.093)#30 | 0.11%(+0.011)#1,524 |
| 31. | Beckett Ridge | 0.12% | 0.032%(+0.090)#31 | 0.11%(+0.008)#1,538 |
| 32. | Glenwillow | 0.12% | 0.032%(+0.086)#32 | 0.11%(+0.004)#1,558 |
| 33. | New Concord | 0.12% | 0.032%(+0.084)#33 | 0.11%(+0.002)#1,571 |
| 34. | Worthington | 0.11% | 0.032%(+0.082)#34 | 0.11%(-0.000)#1,587 |
| 35. | Willoughby | 0.10% | 0.032%(+0.073)#35 | 0.11%(-0.009)#1,636 |
| 36. | Shaker Heights | 0.10% | 0.032%(+0.071)#36 | 0.11%(-0.011)#1,648 |
| 37. | Cuyahoga Falls | 0.10% | 0.032%(+0.071)#37 | 0.11%(-0.012)#1,652 |
| 38. | Northbrook | 0.098% | 0.032%(+0.067)#38 | 0.11%(-0.015)#1,675 |
| 39. | Clayton | 0.098% | 0.032%(+0.066)#39 | 0.11%(-0.016)#1,683 |
| 40. | Hilliard | 0.094% | 0.032%(+0.063)#40 | 0.11%(-0.019)#1,716 |
| 41. | Lyndhurst | 0.086% | 0.032%(+0.054)#41 | 0.11%(-0.028)#1,771 |
| 42. | Tallmadge | 0.081% | 0.032%(+0.050)#42 | 0.11%(-0.032)#1,810 |
| 43. | Hudson | 0.078% | 0.032%(+0.047)#43 | 0.11%(-0.035)#1,834 |
| 44. | Kettering | 0.078% | 0.032%(+0.046)#44 | 0.11%(-0.036)#1,838 |
| 45. | Ashland | 0.078% | 0.032%(+0.046)#45 | 0.11%(-0.036)#1,841 |
| 46. | Kenwood | 0.072% | 0.032%(+0.041)#46 | 0.11%(-0.041)#1,875 |
| 47. | Mason | 0.063% | 0.032%(+0.032)#47 | 0.11%(-0.050)#1,950 |
| 48. | Columbus | 0.062% | 0.032%(+0.031)#48 | 0.11%(-0.051)#1,966 |
| 49. | Reynoldsburg | 0.061% | 0.032%(+0.029)#49 | 0.11%(-0.053)#1,980 |
| 50. | Cleveland Heights | 0.060% | 0.032%(+0.028)#50 | 0.11%(-0.054)#1,989 |
| 51. | Cincinnati | 0.060% | 0.032%(+0.028)#51 | 0.11%(-0.054)#1,990 |
| 52. | Pataskala | 0.056% | 0.032%(+0.024)#52 | 0.11%(-0.058)#2,034 |
| 53. | Franklin | 0.051% | 0.032%(+0.020)#53 | 0.11%(-0.062)#2,099 |
| 54. | Bowling Green | 0.050% | 0.032%(+0.018)#54 | 0.11%(-0.064)#2,118 |
| 55. | Steubenville | 0.050% | 0.032%(+0.018)#55 | 0.11%(-0.064)#2,122 |
| 56. | Fairfield | 0.047% | 0.032%(+0.015)#56 | 0.11%(-0.067)#2,158 |
| 57. | Toledo | 0.047% | 0.032%(+0.015)#57 | 0.11%(-0.067)#2,164 |
| 58. | Dayton | 0.047% | 0.032%(+0.015)#58 | 0.11%(-0.067)#2,165 |
| 59. | Athens | 0.044% | 0.032%(+0.012)#59 | 0.11%(-0.070)#2,197 |
| 60. | Mentor | 0.038% | 0.032%(+0.006)#60 | 0.11%(-0.076)#2,269 |
| 61. | Gahanna | 0.037% | 0.032%(+0.005)#61 | 0.11%(-0.077)#2,291 |
| 62. | Cleveland | 0.032% | 0.032%(+0.001)#62 | 0.11%(-0.081)#2,351 |
| 63. | Mayfield Heights | 0.030% | 0.032%(-0.002)#63 | 0.11%(-0.084)#2,374 |
| 64. | North Ridgeville | 0.028% | 0.032%(-0.003)#64 | 0.11%(-0.085)#2,394 |
| 65. | Elyria | 0.027% | 0.032%(-0.005)#65 | 0.11%(-0.087)#2,415 |
| 66. | North Royalton | 0.026% | 0.032%(-0.006)#66 | 0.11%(-0.088)#2,429 |
| 67. | Cedarville | 0.026% | 0.032%(-0.006)#67 | 0.11%(-0.088)#2,433 |
| 68. | Grove City | 0.024% | 0.032%(-0.007)#68 | 0.11%(-0.090)#2,446 |
| 69. | Westerville | 0.023% | 0.032%(-0.008)#69 | 0.11%(-0.091)#2,461 |
| 70. | Lakewood | 0.020% | 0.032%(-0.012)#70 | 0.11%(-0.094)#2,498 |
| 71. | Beavercreek | 0.011% | 0.032%(-0.021)#71 | 0.11%(-0.103)#2,593 |
| 72. | Akron | 0.0058% | 0.032%(-0.026)#72 | 0.11%(-0.108)#2,634 |
Common Questions
What are the Top 10 Cities with the Highest Percentage of Immigrants from Taiwan in Ohio?
Top 10 Cities with the Highest Percentage of Immigrants from Taiwan in Ohio are:
#1
1.68%
#2
1.28%
#3
1.03%
#4
0.97%
#5
0.96%
#6
0.66%
#7
0.65%
#8
0.51%
#9
0.51%
#10
0.50%
What city has the Highest Percentage of Immigrants from Taiwan in Ohio?
Aurora has the Highest Percentage of Immigrants from Taiwan in Ohio with 1.68%.
What is the Percentage of Immigrants from Taiwan in the State of Ohio?
Percentage of Immigrants from Taiwan in Ohio is 0.032%.
What is the Percentage of Immigrants from Taiwan in the United States?
Percentage of Immigrants from Taiwan in the United States is 0.11%.