Cities with the Highest Percentage of Immigrants from Taiwan in Texas
RELATED REPORTS & OPTIONS
Taiwan
Texas
Compare Cities
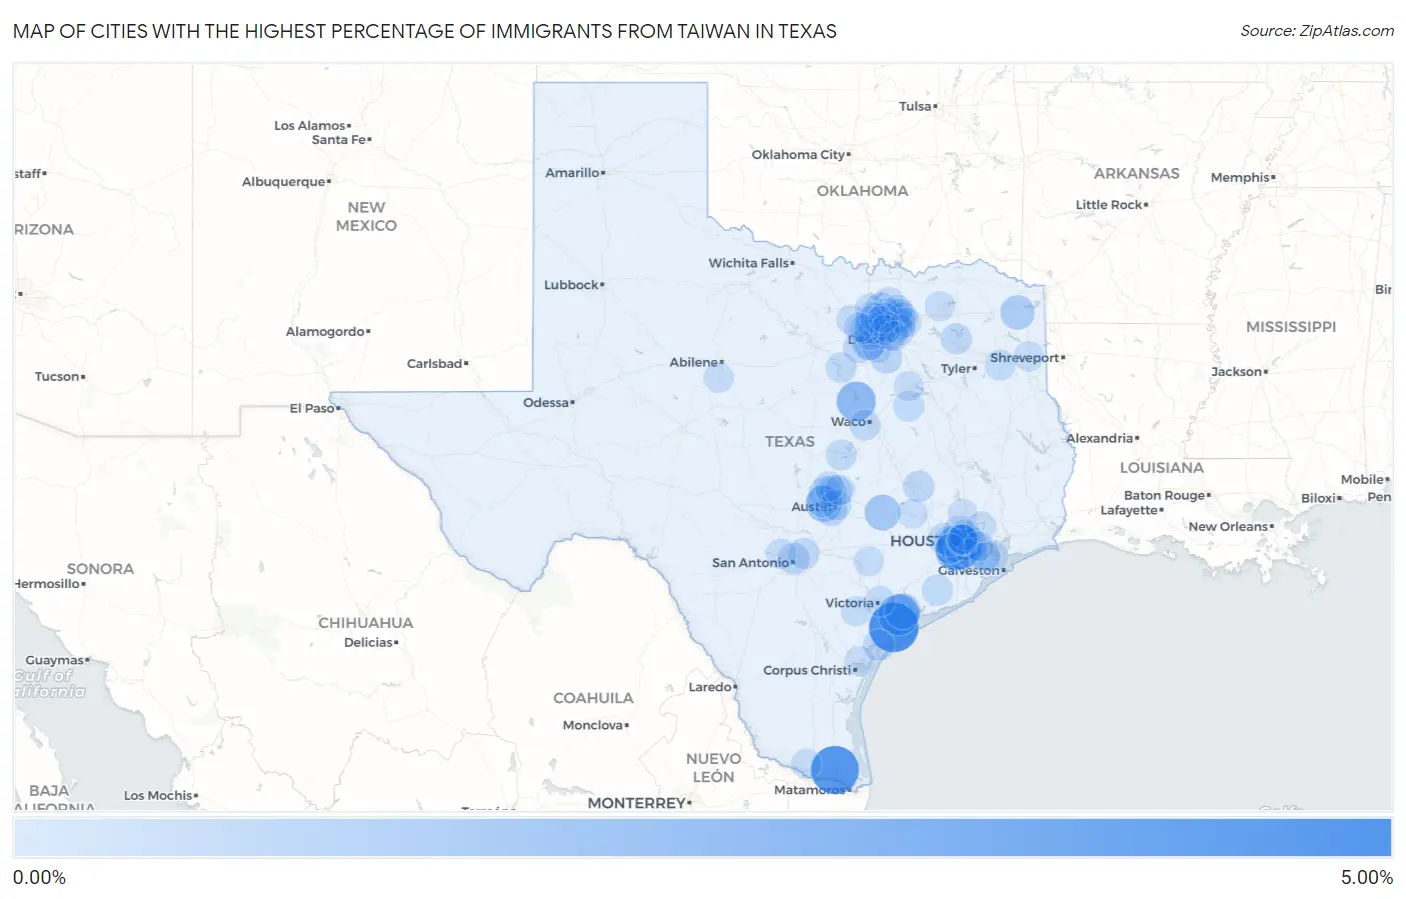
Map of Cities with the Highest Percentage of Immigrants from Taiwan in Texas
0.00%
5.00%
Cities with the Highest Percentage of Immigrants from Taiwan in Texas
| City | Taiwan | vs State | vs National | |
| 1. | Seadrift | 4.31% | 0.095%(+4.22)#1 | 0.11%(+4.20)#23 |
| 2. | Palm Valley | 4.00% | 0.095%(+3.90)#2 | 0.11%(+3.88)#25 |
| 3. | Meadows Place | 3.28% | 0.095%(+3.19)#3 | 0.11%(+3.17)#31 |
| 4. | Port Lavaca | 2.39% | 0.095%(+2.30)#4 | 0.11%(+2.28)#65 |
| 5. | Laguna Park | 2.02% | 0.095%(+1.92)#5 | 0.11%(+1.90)#94 |
| 6. | Sugar Land | 1.96% | 0.095%(+1.87)#6 | 0.11%(+1.85)#96 |
| 7. | West University Place | 1.62% | 0.095%(+1.52)#7 | 0.11%(+1.50)#129 |
| 8. | Bee Cave | 1.39% | 0.095%(+1.30)#8 | 0.11%(+1.28)#151 |
| 9. | Point Comfort | 1.31% | 0.095%(+1.21)#9 | 0.11%(+1.20)#164 |
| 10. | Giddings | 1.24% | 0.095%(+1.14)#10 | 0.11%(+1.12)#175 |
| 11. | Marietta | 0.97% | 0.095%(+0.876)#11 | 0.11%(+0.857)#246 |
| 12. | Bellaire | 0.77% | 0.095%(+0.674)#12 | 0.11%(+0.655)#342 |
| 13. | Plano | 0.72% | 0.095%(+0.624)#13 | 0.11%(+0.606)#364 |
| 14. | Southside Place | 0.72% | 0.095%(+0.621)#14 | 0.11%(+0.603)#365 |
| 15. | Spring Valley Village | 0.66% | 0.095%(+0.568)#15 | 0.11%(+0.550)#400 |
| 16. | Pantego | 0.63% | 0.095%(+0.537)#16 | 0.11%(+0.519)#429 |
| 17. | Allen | 0.57% | 0.095%(+0.471)#17 | 0.11%(+0.453)#483 |
| 18. | Richardson | 0.55% | 0.095%(+0.460)#18 | 0.11%(+0.441)#497 |
| 19. | Sunset Valley | 0.53% | 0.095%(+0.439)#19 | 0.11%(+0.420)#518 |
| 20. | Southlake | 0.53% | 0.095%(+0.434)#20 | 0.11%(+0.416)#522 |
| 21. | Four Corners | 0.51% | 0.095%(+0.418)#21 | 0.11%(+0.399)#538 |
| 22. | Jonestown | 0.50% | 0.095%(+0.406)#22 | 0.11%(+0.387)#553 |
| 23. | Paloma Creek | 0.50% | 0.095%(+0.406)#23 | 0.11%(+0.387)#554 |
| 24. | Oak Leaf | 0.48% | 0.095%(+0.389)#24 | 0.11%(+0.370)#572 |
| 25. | Brushy Creek | 0.48% | 0.095%(+0.385)#25 | 0.11%(+0.367)#576 |
| 26. | The Hills | 0.48% | 0.095%(+0.384)#26 | 0.11%(+0.365)#581 |
| 27. | Olmos Park | 0.39% | 0.095%(+0.298)#27 | 0.11%(+0.280)#696 |
| 28. | Lantana | 0.39% | 0.095%(+0.298)#28 | 0.11%(+0.279)#700 |
| 29. | Fairview | 0.39% | 0.095%(+0.291)#29 | 0.11%(+0.273)#713 |
| 30. | Lamar | 0.38% | 0.095%(+0.290)#30 | 0.11%(+0.271)#714 |
| 31. | College Station | 0.38% | 0.095%(+0.283)#31 | 0.11%(+0.265)#723 |
| 32. | Edgecliff Village | 0.38% | 0.095%(+0.282)#32 | 0.11%(+0.263)#730 |
| 33. | Katy | 0.37% | 0.095%(+0.277)#33 | 0.11%(+0.259)#739 |
| 34. | Alba | 0.37% | 0.095%(+0.277)#34 | 0.11%(+0.258)#741 |
| 35. | Murphy | 0.34% | 0.095%(+0.240)#35 | 0.11%(+0.222)#798 |
| 36. | Universal City | 0.33% | 0.095%(+0.238)#36 | 0.11%(+0.220)#803 |
| 37. | Stafford | 0.33% | 0.095%(+0.235)#37 | 0.11%(+0.217)#809 |
| 38. | Missouri City | 0.31% | 0.095%(+0.213)#38 | 0.11%(+0.195)#852 |
| 39. | Bay City | 0.31% | 0.095%(+0.213)#39 | 0.11%(+0.194)#854 |
| 40. | Colleyville | 0.31% | 0.095%(+0.210)#40 | 0.11%(+0.192)#862 |
| 41. | Bacliff | 0.30% | 0.095%(+0.205)#41 | 0.11%(+0.187)#880 |
| 42. | University Park | 0.29% | 0.095%(+0.195)#42 | 0.11%(+0.176)#912 |
| 43. | Jersey Village | 0.28% | 0.095%(+0.188)#43 | 0.11%(+0.170)#922 |
| 44. | Irving | 0.27% | 0.095%(+0.173)#44 | 0.11%(+0.155)#956 |
| 45. | Woodway | 0.27% | 0.095%(+0.171)#45 | 0.11%(+0.152)#963 |
| 46. | Frisco | 0.27% | 0.095%(+0.170)#46 | 0.11%(+0.152)#965 |
| 47. | Harker Heights | 0.26% | 0.095%(+0.162)#47 | 0.11%(+0.144)#988 |
| 48. | Pecan Plantation | 0.26% | 0.095%(+0.160)#48 | 0.11%(+0.141)#997 |
| 49. | Wortham | 0.25% | 0.095%(+0.156)#49 | 0.11%(+0.138)#1,009 |
| 50. | Hunters Creek Village | 0.25% | 0.095%(+0.156)#50 | 0.11%(+0.137)#1,010 |
| 51. | Celina | 0.25% | 0.095%(+0.151)#51 | 0.11%(+0.133)#1,027 |
| 52. | Cedar Park | 0.24% | 0.095%(+0.143)#52 | 0.11%(+0.125)#1,043 |
| 53. | Bunker Hill Village | 0.24% | 0.095%(+0.140)#53 | 0.11%(+0.122)#1,052 |
| 54. | Austin | 0.23% | 0.095%(+0.139)#54 | 0.11%(+0.120)#1,057 |
| 55. | Kilgore | 0.23% | 0.095%(+0.136)#55 | 0.11%(+0.118)#1,063 |
| 56. | Cinco Ranch | 0.22% | 0.095%(+0.128)#56 | 0.11%(+0.109)#1,091 |
| 57. | Webster | 0.22% | 0.095%(+0.124)#57 | 0.11%(+0.106)#1,107 |
| 58. | Coppell | 0.21% | 0.095%(+0.112)#58 | 0.11%(+0.093)#1,136 |
| 59. | Lucas | 0.21% | 0.095%(+0.111)#59 | 0.11%(+0.093)#1,140 |
| 60. | Piney Point Village | 0.19% | 0.095%(+0.097)#60 | 0.11%(+0.079)#1,194 |
| 61. | Houston | 0.18% | 0.095%(+0.088)#61 | 0.11%(+0.070)#1,234 |
| 62. | Victoria | 0.18% | 0.095%(+0.087)#62 | 0.11%(+0.068)#1,241 |
| 63. | Pearland | 0.18% | 0.095%(+0.083)#63 | 0.11%(+0.065)#1,258 |
| 64. | Grand Prairie | 0.17% | 0.095%(+0.076)#64 | 0.11%(+0.058)#1,289 |
| 65. | Marshall | 0.17% | 0.095%(+0.071)#65 | 0.11%(+0.052)#1,303 |
| 66. | Helotes | 0.16% | 0.095%(+0.069)#66 | 0.11%(+0.050)#1,311 |
| 67. | Rhome | 0.16% | 0.095%(+0.068)#67 | 0.11%(+0.050)#1,317 |
| 68. | Grapevine | 0.16% | 0.095%(+0.064)#68 | 0.11%(+0.046)#1,333 |
| 69. | Garland | 0.16% | 0.095%(+0.063)#69 | 0.11%(+0.045)#1,343 |
| 70. | Mckinney | 0.16% | 0.095%(+0.061)#70 | 0.11%(+0.042)#1,351 |
| 71. | Portland | 0.15% | 0.095%(+0.059)#71 | 0.11%(+0.040)#1,362 |
| 72. | Arlington | 0.15% | 0.095%(+0.053)#72 | 0.11%(+0.035)#1,396 |
| 73. | Carrollton | 0.15% | 0.095%(+0.051)#73 | 0.11%(+0.033)#1,405 |
| 74. | Bedford | 0.15% | 0.095%(+0.050)#74 | 0.11%(+0.032)#1,413 |
| 75. | Tuscola | 0.14% | 0.095%(+0.048)#75 | 0.11%(+0.030)#1,426 |
| 76. | Commerce | 0.14% | 0.095%(+0.048)#76 | 0.11%(+0.030)#1,429 |
| 77. | Shiner | 0.14% | 0.095%(+0.048)#77 | 0.11%(+0.030)#1,430 |
| 78. | Mcallen | 0.13% | 0.095%(+0.037)#78 | 0.11%(+0.019)#1,482 |
| 79. | Denton | 0.13% | 0.095%(+0.036)#79 | 0.11%(+0.018)#1,490 |
| 80. | League City | 0.13% | 0.095%(+0.034)#80 | 0.11%(+0.016)#1,500 |
| 81. | Lewisville | 0.12% | 0.095%(+0.029)#81 | 0.11%(+0.010)#1,528 |
| 82. | Addison | 0.12% | 0.095%(+0.028)#82 | 0.11%(+0.010)#1,531 |
| 83. | Corsicana | 0.12% | 0.095%(+0.024)#83 | 0.11%(+0.006)#1,549 |
| 84. | Flower Mound | 0.11% | 0.095%(+0.020)#84 | 0.11%(+0.001)#1,579 |
| 85. | Pecan Grove | 0.11% | 0.095%(+0.019)#85 | 0.11%(+0.000)#1,584 |
| 86. | Keller | 0.11% | 0.095%(+0.017)#86 | 0.11%(-0.001)#1,595 |
| 87. | Goliad | 0.11% | 0.095%(+0.015)#87 | 0.11%(-0.004)#1,614 |
| 88. | Highland Village | 0.11% | 0.095%(+0.012)#88 | 0.11%(-0.007)#1,626 |
| 89. | Brenham | 0.10% | 0.095%(+0.007)#89 | 0.11%(-0.012)#1,655 |
| 90. | Wylie | 0.098% | 0.095%(+0.003)#90 | 0.11%(-0.016)#1,678 |
| 91. | Round Rock | 0.098% | 0.095%(+0.003)#91 | 0.11%(-0.016)#1,681 |
| 92. | The Woodlands | 0.095% | 0.095%(+0.000)#92 | 0.11%(-0.018)#1,704 |
| 93. | Farmers Branch | 0.094% | 0.095%(-0.001)#93 | 0.11%(-0.019)#1,715 |
| 94. | The Colony | 0.093% | 0.095%(-0.003)#94 | 0.11%(-0.021)#1,725 |
| 95. | Atascocita | 0.090% | 0.095%(-0.005)#95 | 0.11%(-0.024)#1,744 |
| 96. | South Houston | 0.087% | 0.095%(-0.009)#96 | 0.11%(-0.027)#1,765 |
| 97. | Hedwig Village | 0.086% | 0.095%(-0.009)#97 | 0.11%(-0.027)#1,769 |
| 98. | Haslet | 0.086% | 0.095%(-0.010)#98 | 0.11%(-0.028)#1,777 |
| 99. | Leander | 0.085% | 0.095%(-0.010)#99 | 0.11%(-0.029)#1,785 |
| 100. | Dallas | 0.081% | 0.095%(-0.014)#100 | 0.11%(-0.032)#1,815 |
Common Questions
What are the Top 10 Cities with the Highest Percentage of Immigrants from Taiwan in Texas?
Top 10 Cities with the Highest Percentage of Immigrants from Taiwan in Texas are:
#1
4.31%
#2
4.00%
#3
3.28%
#4
2.39%
#5
2.02%
#6
1.96%
#7
1.62%
#8
1.39%
#9
1.31%
#10
1.24%
What city has the Highest Percentage of Immigrants from Taiwan in Texas?
Seadrift has the Highest Percentage of Immigrants from Taiwan in Texas with 4.31%.
What is the Percentage of Immigrants from Taiwan in the State of Texas?
Percentage of Immigrants from Taiwan in Texas is 0.095%.
What is the Percentage of Immigrants from Taiwan in the United States?
Percentage of Immigrants from Taiwan in the United States is 0.11%.