Cities with the Largest Eastern European Community in Maryland
RELATED REPORTS & OPTIONS
Eastern European
Maryland
Compare Cities
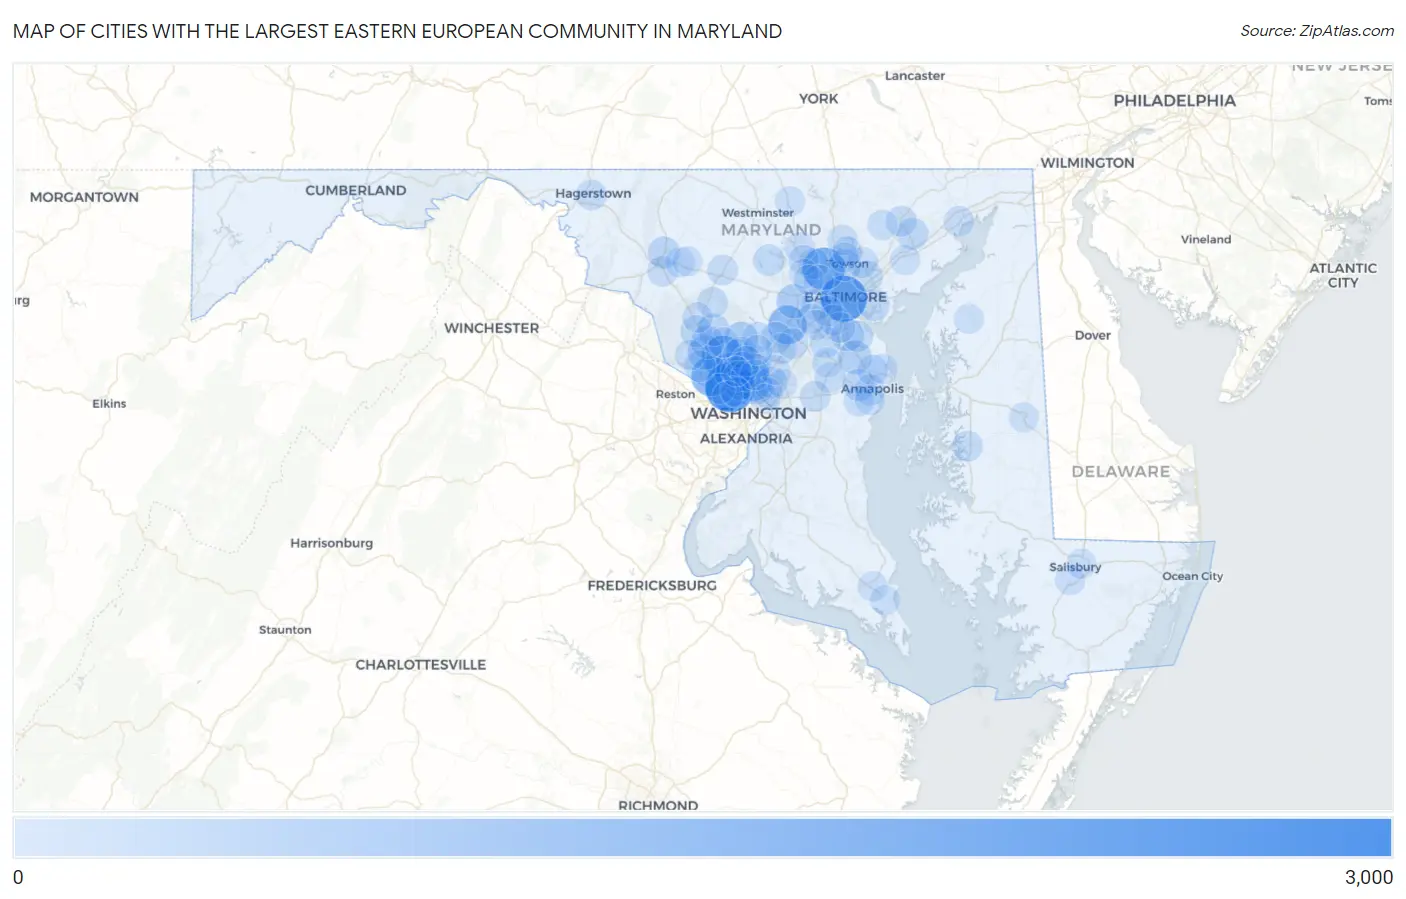
Map of Cities with the Largest Eastern European Community in Maryland
0
3,000
Cities with the Largest Eastern European Community in Maryland
| City | Eastern European | vs State | vs National | |
| 1. | Bethesda | 2,821 | 34,084(8.28%)#1 | 1,005,654(0.28%)#16 |
| 2. | Baltimore | 2,324 | 34,084(6.82%)#2 | 1,005,654(0.23%)#21 |
| 3. | Pikesville | 1,811 | 34,084(5.31%)#3 | 1,005,654(0.18%)#31 |
| 4. | Rockville | 1,578 | 34,084(4.63%)#4 | 1,005,654(0.16%)#42 |
| 5. | Potomac | 1,430 | 34,084(4.20%)#5 | 1,005,654(0.14%)#43 |
| 6. | Columbia | 1,236 | 34,084(3.63%)#6 | 1,005,654(0.12%)#53 |
| 7. | Silver Spring | 980 | 34,084(2.88%)#7 | 1,005,654(0.10%)#85 |
| 8. | North Bethesda | 673 | 34,084(1.97%)#8 | 1,005,654(0.07%)#152 |
| 9. | Kemp Mill | 611 | 34,084(1.79%)#9 | 1,005,654(0.06%)#171 |
| 10. | Ellicott City | 610 | 34,084(1.79%)#10 | 1,005,654(0.06%)#172 |
| 11. | North Potomac | 608 | 34,084(1.78%)#11 | 1,005,654(0.06%)#174 |
| 12. | Olney | 573 | 34,084(1.68%)#12 | 1,005,654(0.06%)#186 |
| 13. | Takoma Park | 526 | 34,084(1.54%)#13 | 1,005,654(0.05%)#209 |
| 14. | Severna Park | 520 | 34,084(1.53%)#14 | 1,005,654(0.05%)#212 |
| 15. | Gaithersburg | 462 | 34,084(1.36%)#15 | 1,005,654(0.05%)#235 |
| 16. | Glen Burnie | 383 | 34,084(1.12%)#16 | 1,005,654(0.04%)#298 |
| 17. | Towson | 345 | 34,084(1.01%)#17 | 1,005,654(0.03%)#338 |
| 18. | Montgomery Village | 340 | 34,084(1.00%)#18 | 1,005,654(0.03%)#345 |
| 19. | Chevy Chase | 325 | 34,084(0.95%)#19 | 1,005,654(0.03%)#371 |
| 20. | Parole | 306 | 34,084(0.90%)#20 | 1,005,654(0.03%)#404 |
| 21. | Frederick | 302 | 34,084(0.89%)#21 | 1,005,654(0.03%)#408 |
| 22. | Aspen Hill | 293 | 34,084(0.86%)#22 | 1,005,654(0.03%)#430 |
| 23. | Bel Air South | 288 | 34,084(0.84%)#23 | 1,005,654(0.03%)#435 |
| 24. | Germantown | 267 | 34,084(0.78%)#24 | 1,005,654(0.03%)#482 |
| 25. | Dundalk | 267 | 34,084(0.78%)#25 | 1,005,654(0.03%)#483 |
| 26. | Colesville | 246 | 34,084(0.72%)#26 | 1,005,654(0.02%)#538 |
| 27. | College Park | 237 | 34,084(0.70%)#27 | 1,005,654(0.02%)#552 |
| 28. | Eldersburg | 225 | 34,084(0.66%)#28 | 1,005,654(0.02%)#597 |
| 29. | Severn | 212 | 34,084(0.62%)#29 | 1,005,654(0.02%)#647 |
| 30. | Travilah | 207 | 34,084(0.61%)#30 | 1,005,654(0.02%)#666 |
| 31. | Leisure World | 205 | 34,084(0.60%)#31 | 1,005,654(0.02%)#672 |
| 32. | Pasadena | 180 | 34,084(0.53%)#32 | 1,005,654(0.02%)#790 |
| 33. | Fulton | 172 | 34,084(0.50%)#33 | 1,005,654(0.02%)#834 |
| 34. | North Laurel | 169 | 34,084(0.50%)#34 | 1,005,654(0.02%)#854 |
| 35. | Easton | 156 | 34,084(0.46%)#35 | 1,005,654(0.02%)#930 |
| 36. | Overlea | 156 | 34,084(0.46%)#36 | 1,005,654(0.02%)#933 |
| 37. | Carney | 155 | 34,084(0.45%)#37 | 1,005,654(0.02%)#937 |
| 38. | Annapolis | 154 | 34,084(0.45%)#38 | 1,005,654(0.02%)#943 |
| 39. | Crofton | 151 | 34,084(0.44%)#39 | 1,005,654(0.02%)#957 |
| 40. | Bel Air North | 146 | 34,084(0.43%)#40 | 1,005,654(0.01%)#990 |
| 41. | West Laurel | 146 | 34,084(0.43%)#41 | 1,005,654(0.01%)#998 |
| 42. | Hagerstown | 144 | 34,084(0.42%)#42 | 1,005,654(0.01%)#1,006 |
| 43. | Bowie | 142 | 34,084(0.42%)#43 | 1,005,654(0.01%)#1,022 |
| 44. | Damascus | 138 | 34,084(0.40%)#44 | 1,005,654(0.01%)#1,063 |
| 45. | Wheaton | 136 | 34,084(0.40%)#45 | 1,005,654(0.01%)#1,077 |
| 46. | Garrison | 121 | 34,084(0.36%)#46 | 1,005,654(0.01%)#1,212 |
| 47. | Mount Airy | 121 | 34,084(0.36%)#47 | 1,005,654(0.01%)#1,213 |
| 48. | Catonsville | 120 | 34,084(0.35%)#48 | 1,005,654(0.01%)#1,216 |
| 49. | Linthicum | 118 | 34,084(0.35%)#49 | 1,005,654(0.01%)#1,241 |
| 50. | Ballenger Creek | 117 | 34,084(0.34%)#50 | 1,005,654(0.01%)#1,245 |
| 51. | Ashton Sandy Spring | 113 | 34,084(0.33%)#51 | 1,005,654(0.01%)#1,300 |
| 52. | Arnold | 112 | 34,084(0.33%)#52 | 1,005,654(0.01%)#1,306 |
| 53. | South Kensington | 110 | 34,084(0.32%)#53 | 1,005,654(0.01%)#1,325 |
| 54. | Hyattsville | 107 | 34,084(0.31%)#54 | 1,005,654(0.01%)#1,356 |
| 55. | Reisterstown | 104 | 34,084(0.31%)#55 | 1,005,654(0.01%)#1,387 |
| 56. | Ferndale | 103 | 34,084(0.30%)#56 | 1,005,654(0.01%)#1,399 |
| 57. | Clarksburg | 96 | 34,084(0.28%)#57 | 1,005,654(0.01%)#1,486 |
| 58. | Redland | 94 | 34,084(0.28%)#58 | 1,005,654(0.01%)#1,517 |
| 59. | Wildewood | 94 | 34,084(0.28%)#59 | 1,005,654(0.01%)#1,519 |
| 60. | Forest Glen | 94 | 34,084(0.28%)#60 | 1,005,654(0.01%)#1,520 |
| 61. | Darnestown | 94 | 34,084(0.28%)#61 | 1,005,654(0.01%)#1,521 |
| 62. | Havre De Grace | 93 | 34,084(0.27%)#62 | 1,005,654(0.01%)#1,533 |
| 63. | Fruitland | 85 | 34,084(0.25%)#63 | 1,005,654(0.01%)#1,657 |
| 64. | Glenmont | 83 | 34,084(0.24%)#64 | 1,005,654(0.01%)#1,680 |
| 65. | Arbutus | 79 | 34,084(0.23%)#65 | 1,005,654(0.01%)#1,756 |
| 66. | Owings Mills | 76 | 34,084(0.22%)#66 | 1,005,654(0.01%)#1,814 |
| 67. | Lochearn | 75 | 34,084(0.22%)#67 | 1,005,654(0.01%)#1,828 |
| 68. | Somerset | 75 | 34,084(0.22%)#68 | 1,005,654(0.01%)#1,842 |
| 69. | Beltsville | 74 | 34,084(0.22%)#69 | 1,005,654(0.01%)#1,847 |
| 70. | Ilchester | 73 | 34,084(0.21%)#70 | 1,005,654(0.01%)#1,866 |
| 71. | Elkridge | 71 | 34,084(0.21%)#71 | 1,005,654(0.01%)#1,913 |
| 72. | Edgewater | 71 | 34,084(0.21%)#72 | 1,005,654(0.01%)#1,921 |
| 73. | Cockeysville | 70 | 34,084(0.21%)#73 | 1,005,654(0.01%)#1,938 |
| 74. | Friendship Heights Village | 70 | 34,084(0.21%)#74 | 1,005,654(0.01%)#1,948 |
| 75. | Fallston | 69 | 34,084(0.20%)#75 | 1,005,654(0.01%)#1,970 |
| 76. | Four Corners | 69 | 34,084(0.20%)#76 | 1,005,654(0.01%)#1,973 |
| 77. | Joppatowne | 60 | 34,084(0.18%)#77 | 1,005,654(0.01%)#2,197 |
| 78. | Green Valley | 60 | 34,084(0.18%)#78 | 1,005,654(0.01%)#2,198 |
| 79. | Spring Ridge | 58 | 34,084(0.17%)#79 | 1,005,654(0.01%)#2,266 |
| 80. | Burnt Mills | 58 | 34,084(0.17%)#80 | 1,005,654(0.01%)#2,268 |
| 81. | California | 57 | 34,084(0.17%)#81 | 1,005,654(0.01%)#2,287 |
| 82. | Cabin John | 57 | 34,084(0.17%)#82 | 1,005,654(0.01%)#2,300 |
| 83. | Odenton | 56 | 34,084(0.16%)#83 | 1,005,654(0.01%)#2,309 |
| 84. | Randallstown | 54 | 34,084(0.16%)#84 | 1,005,654(0.01%)#2,369 |
| 85. | Lutherville | 54 | 34,084(0.16%)#85 | 1,005,654(0.01%)#2,387 |
| 86. | Cloverly | 51 | 34,084(0.15%)#86 | 1,005,654(0.01%)#2,473 |
| 87. | Timonium | 51 | 34,084(0.15%)#87 | 1,005,654(0.01%)#2,482 |
| 88. | Chestertown | 50 | 34,084(0.15%)#88 | 1,005,654(0.00%)#2,526 |
| 89. | Salisbury | 49 | 34,084(0.14%)#89 | 1,005,654(0.00%)#2,547 |
| 90. | Annapolis Neck | 48 | 34,084(0.14%)#90 | 1,005,654(0.00%)#2,596 |
| 91. | Cape St Claire | 47 | 34,084(0.14%)#91 | 1,005,654(0.00%)#2,634 |
| 92. | Brookmont | 47 | 34,084(0.14%)#92 | 1,005,654(0.00%)#2,649 |
| 93. | Mount Rainier | 46 | 34,084(0.13%)#93 | 1,005,654(0.00%)#2,675 |
| 94. | Garrett Park | 44 | 34,084(0.13%)#94 | 1,005,654(0.00%)#2,762 |
| 95. | Milford Mill | 42 | 34,084(0.12%)#95 | 1,005,654(0.00%)#2,826 |
| 96. | Greenbelt | 42 | 34,084(0.12%)#96 | 1,005,654(0.00%)#2,830 |
| 97. | Hampstead | 42 | 34,084(0.12%)#97 | 1,005,654(0.00%)#2,850 |
| 98. | Denton | 41 | 34,084(0.12%)#98 | 1,005,654(0.00%)#2,899 |
| 99. | Lexington Park | 40 | 34,084(0.12%)#99 | 1,005,654(0.00%)#2,940 |
| 100. | Linganore | 40 | 34,084(0.12%)#100 | 1,005,654(0.00%)#2,945 |
Common Questions
What are the Top 10 Cities with the Largest Eastern European Community in Maryland?
Top 10 Cities with the Largest Eastern European Community in Maryland are:
#1
2,821
#2
2,324
#3
1,811
#4
1,578
#5
1,430
#6
1,236
#7
980
#8
673
#9
611
#10
610
What city has the Largest Eastern European Community in Maryland?
Bethesda has the Largest Eastern European Community in Maryland with 2,821.
What is the Total Eastern European Population in the State of Maryland?
Total Eastern European Population in Maryland is 34,084.
What is the Total Eastern European Population in the United States?
Total Eastern European Population in the United States is 1,005,654.