Cities with the Largest Eastern European Community in New York
RELATED REPORTS & OPTIONS
Eastern European
New York
Compare Cities
Map of Cities with the Largest Eastern European Community in New York
0
80,000
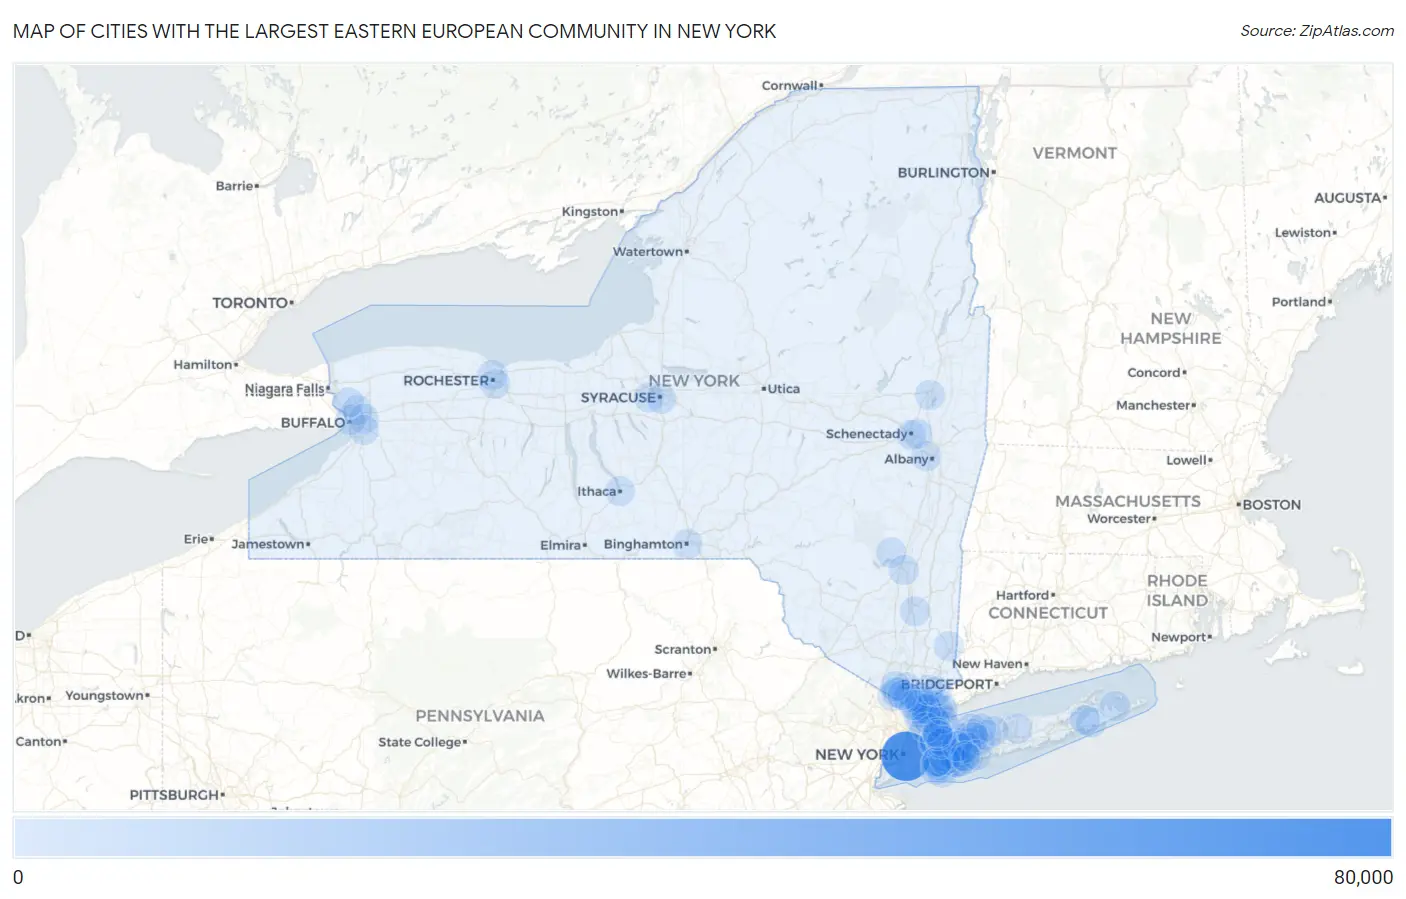
Cities with the Largest Eastern European Community in New York
| City | Eastern European | vs State | vs National | |
| 1. | New York | 73,403 | 148,934(49.29%)#1 | 1,005,654(7.30%)#1 |
| 2. | Plainview | 2,282 | 148,934(1.53%)#2 | 1,005,654(0.23%)#22 |
| 3. | New Rochelle | 1,128 | 148,934(0.76%)#3 | 1,005,654(0.11%)#58 |
| 4. | Melville | 1,121 | 148,934(0.75%)#4 | 1,005,654(0.11%)#60 |
| 5. | White Plains | 1,034 | 148,934(0.69%)#5 | 1,005,654(0.10%)#76 |
| 6. | Woodmere | 1,026 | 148,934(0.69%)#6 | 1,005,654(0.10%)#78 |
| 7. | Scarsdale | 902 | 148,934(0.61%)#7 | 1,005,654(0.09%)#97 |
| 8. | Port Washington | 894 | 148,934(0.60%)#8 | 1,005,654(0.09%)#98 |
| 9. | Harrison | 836 | 148,934(0.56%)#9 | 1,005,654(0.08%)#107 |
| 10. | New City | 832 | 148,934(0.56%)#10 | 1,005,654(0.08%)#109 |
| 11. | Commack | 831 | 148,934(0.56%)#11 | 1,005,654(0.08%)#110 |
| 12. | Great Neck | 810 | 148,934(0.54%)#12 | 1,005,654(0.08%)#114 |
| 13. | Dix Hills | 752 | 148,934(0.50%)#13 | 1,005,654(0.07%)#125 |
| 14. | East Hills | 679 | 148,934(0.46%)#14 | 1,005,654(0.07%)#149 |
| 15. | East Meadow | 676 | 148,934(0.45%)#15 | 1,005,654(0.07%)#150 |
| 16. | Rochester | 673 | 148,934(0.45%)#16 | 1,005,654(0.07%)#151 |
| 17. | Yonkers | 615 | 148,934(0.41%)#17 | 1,005,654(0.06%)#167 |
| 18. | Oceanside | 614 | 148,934(0.41%)#18 | 1,005,654(0.06%)#168 |
| 19. | Rye Brook | 568 | 148,934(0.38%)#19 | 1,005,654(0.06%)#188 |
| 20. | Long Beach | 550 | 148,934(0.37%)#20 | 1,005,654(0.05%)#198 |
| 21. | Albany | 521 | 148,934(0.35%)#21 | 1,005,654(0.05%)#210 |
| 22. | Springs | 516 | 148,934(0.35%)#22 | 1,005,654(0.05%)#213 |
| 23. | Syosset | 464 | 148,934(0.31%)#23 | 1,005,654(0.05%)#234 |
| 24. | Buffalo | 458 | 148,934(0.31%)#24 | 1,005,654(0.05%)#237 |
| 25. | Levittown | 439 | 148,934(0.29%)#25 | 1,005,654(0.04%)#252 |
| 26. | Greenville Cdp Westchester County | 427 | 148,934(0.29%)#26 | 1,005,654(0.04%)#262 |
| 27. | Great Neck Plaza | 392 | 148,934(0.26%)#27 | 1,005,654(0.04%)#285 |
| 28. | Lynbrook | 389 | 148,934(0.26%)#28 | 1,005,654(0.04%)#291 |
| 29. | Jericho | 389 | 148,934(0.26%)#29 | 1,005,654(0.04%)#292 |
| 30. | Bellmore | 368 | 148,934(0.25%)#30 | 1,005,654(0.04%)#315 |
| 31. | Dobbs Ferry | 356 | 148,934(0.24%)#31 | 1,005,654(0.04%)#327 |
| 32. | Fairmount | 356 | 148,934(0.24%)#32 | 1,005,654(0.04%)#328 |
| 33. | Coram | 353 | 148,934(0.24%)#33 | 1,005,654(0.04%)#332 |
| 34. | North Bellmore | 348 | 148,934(0.23%)#34 | 1,005,654(0.03%)#336 |
| 35. | Hewlett | 338 | 148,934(0.23%)#35 | 1,005,654(0.03%)#348 |
| 36. | West Hempstead | 335 | 148,934(0.22%)#36 | 1,005,654(0.03%)#353 |
| 37. | Great Neck Estates | 323 | 148,934(0.22%)#37 | 1,005,654(0.03%)#374 |
| 38. | Spackenkill | 310 | 148,934(0.21%)#38 | 1,005,654(0.03%)#395 |
| 39. | Brighton | 307 | 148,934(0.21%)#39 | 1,005,654(0.03%)#401 |
| 40. | East Setauket | 305 | 148,934(0.20%)#40 | 1,005,654(0.03%)#406 |
| 41. | Huntington | 296 | 148,934(0.20%)#41 | 1,005,654(0.03%)#424 |
| 42. | Merrick | 290 | 148,934(0.19%)#42 | 1,005,654(0.03%)#432 |
| 43. | Hastings On Hudson | 278 | 148,934(0.19%)#43 | 1,005,654(0.03%)#456 |
| 44. | Brewster Hill | 276 | 148,934(0.19%)#44 | 1,005,654(0.03%)#461 |
| 45. | Spring Valley | 272 | 148,934(0.18%)#45 | 1,005,654(0.03%)#467 |
| 46. | Port Washington North | 272 | 148,934(0.18%)#46 | 1,005,654(0.03%)#469 |
| 47. | Glen Cove | 266 | 148,934(0.18%)#47 | 1,005,654(0.03%)#485 |
| 48. | Niskayuna | 261 | 148,934(0.18%)#48 | 1,005,654(0.03%)#493 |
| 49. | Ithaca | 259 | 148,934(0.17%)#49 | 1,005,654(0.03%)#499 |
| 50. | Irvington | 258 | 148,934(0.17%)#50 | 1,005,654(0.03%)#501 |
| 51. | Bethpage | 256 | 148,934(0.17%)#51 | 1,005,654(0.03%)#504 |
| 52. | Smithtown | 255 | 148,934(0.17%)#52 | 1,005,654(0.03%)#505 |
| 53. | Lawrence | 254 | 148,934(0.17%)#53 | 1,005,654(0.03%)#512 |
| 54. | Woodstock | 252 | 148,934(0.17%)#54 | 1,005,654(0.03%)#517 |
| 55. | Kingston | 249 | 148,934(0.17%)#55 | 1,005,654(0.02%)#529 |
| 56. | Uniondale | 246 | 148,934(0.17%)#56 | 1,005,654(0.02%)#535 |
| 57. | Rye | 246 | 148,934(0.17%)#57 | 1,005,654(0.02%)#537 |
| 58. | Huntington Station | 239 | 148,934(0.16%)#58 | 1,005,654(0.02%)#546 |
| 59. | Mamaroneck | 237 | 148,934(0.16%)#59 | 1,005,654(0.02%)#553 |
| 60. | East Northport | 235 | 148,934(0.16%)#60 | 1,005,654(0.02%)#560 |
| 61. | Flower Hill | 228 | 148,934(0.15%)#61 | 1,005,654(0.02%)#583 |
| 62. | Wantagh | 226 | 148,934(0.15%)#62 | 1,005,654(0.02%)#591 |
| 63. | Old Bethpage | 224 | 148,934(0.15%)#63 | 1,005,654(0.02%)#606 |
| 64. | Water Mill | 224 | 148,934(0.15%)#64 | 1,005,654(0.02%)#608 |
| 65. | Airmont | 221 | 148,934(0.15%)#65 | 1,005,654(0.02%)#618 |
| 66. | South Huntington | 220 | 148,934(0.15%)#66 | 1,005,654(0.02%)#621 |
| 67. | Ardsley | 219 | 148,934(0.15%)#67 | 1,005,654(0.02%)#625 |
| 68. | Eggertsville | 217 | 148,934(0.15%)#68 | 1,005,654(0.02%)#633 |
| 69. | Monsey | 215 | 148,934(0.14%)#69 | 1,005,654(0.02%)#639 |
| 70. | Valley Stream | 206 | 148,934(0.14%)#70 | 1,005,654(0.02%)#669 |
| 71. | Rockville Centre | 203 | 148,934(0.14%)#71 | 1,005,654(0.02%)#680 |
| 72. | Roslyn Estates | 200 | 148,934(0.13%)#72 | 1,005,654(0.02%)#697 |
| 73. | Cheektowaga | 199 | 148,934(0.13%)#73 | 1,005,654(0.02%)#698 |
| 74. | Sleepy Hollow | 195 | 148,934(0.13%)#74 | 1,005,654(0.02%)#726 |
| 75. | West Seneca | 194 | 148,934(0.13%)#75 | 1,005,654(0.02%)#728 |
| 76. | North Hills | 193 | 148,934(0.13%)#76 | 1,005,654(0.02%)#735 |
| 77. | Schenectady | 192 | 148,934(0.13%)#77 | 1,005,654(0.02%)#738 |
| 78. | Tarrytown | 192 | 148,934(0.13%)#78 | 1,005,654(0.02%)#741 |
| 79. | Syracuse | 190 | 148,934(0.13%)#79 | 1,005,654(0.02%)#748 |
| 80. | Binghamton | 181 | 148,934(0.12%)#80 | 1,005,654(0.02%)#784 |
| 81. | Hartsdale | 181 | 148,934(0.12%)#81 | 1,005,654(0.02%)#789 |
| 82. | Eastchester | 180 | 148,934(0.12%)#82 | 1,005,654(0.02%)#791 |
| 83. | South Valley Stream | 180 | 148,934(0.12%)#83 | 1,005,654(0.02%)#792 |
| 84. | Pelham Manor | 177 | 148,934(0.12%)#84 | 1,005,654(0.02%)#802 |
| 85. | Hicksville | 176 | 148,934(0.12%)#85 | 1,005,654(0.02%)#803 |
| 86. | North Sea | 176 | 148,934(0.12%)#86 | 1,005,654(0.02%)#806 |
| 87. | Tonawanda | 175 | 148,934(0.12%)#87 | 1,005,654(0.02%)#811 |
| 88. | West Nyack | 175 | 148,934(0.12%)#88 | 1,005,654(0.02%)#817 |
| 89. | Piermont | 175 | 148,934(0.12%)#89 | 1,005,654(0.02%)#818 |
| 90. | East Massapequa | 174 | 148,934(0.12%)#90 | 1,005,654(0.02%)#820 |
| 91. | Port Chester | 173 | 148,934(0.12%)#91 | 1,005,654(0.02%)#824 |
| 92. | West Babylon | 172 | 148,934(0.12%)#92 | 1,005,654(0.02%)#831 |
| 93. | North Massapequa | 171 | 148,934(0.11%)#93 | 1,005,654(0.02%)#842 |
| 94. | Pleasantville | 170 | 148,934(0.11%)#94 | 1,005,654(0.02%)#848 |
| 95. | Manorhaven | 168 | 148,934(0.11%)#95 | 1,005,654(0.02%)#862 |
| 96. | Saratoga Springs | 166 | 148,934(0.11%)#96 | 1,005,654(0.02%)#872 |
| 97. | Sands Point | 166 | 148,934(0.11%)#97 | 1,005,654(0.02%)#873 |
| 98. | Armonk | 163 | 148,934(0.11%)#98 | 1,005,654(0.02%)#894 |
| 99. | Wesley Hills | 162 | 148,934(0.11%)#99 | 1,005,654(0.02%)#898 |
| 100. | Nanuet | 159 | 148,934(0.11%)#100 | 1,005,654(0.02%)#913 |
Common Questions
What are the Top 10 Cities with the Largest Eastern European Community in New York?
Top 10 Cities with the Largest Eastern European Community in New York are:
#1
73,403
#2
2,282
#3
1,128
#4
1,121
#5
1,034
#6
1,026
#7
902
#8
894
#9
836
#10
832
What city has the Largest Eastern European Community in New York?
New York has the Largest Eastern European Community in New York with 73,403.
What is the Total Eastern European Population in the State of New York?
Total Eastern European Population in New York is 148,934.
What is the Total Eastern European Population in the United States?
Total Eastern European Population in the United States is 1,005,654.