Cities with the Largest Eastern European Community in Ohio
RELATED REPORTS & OPTIONS
Eastern European
Ohio
Compare Cities
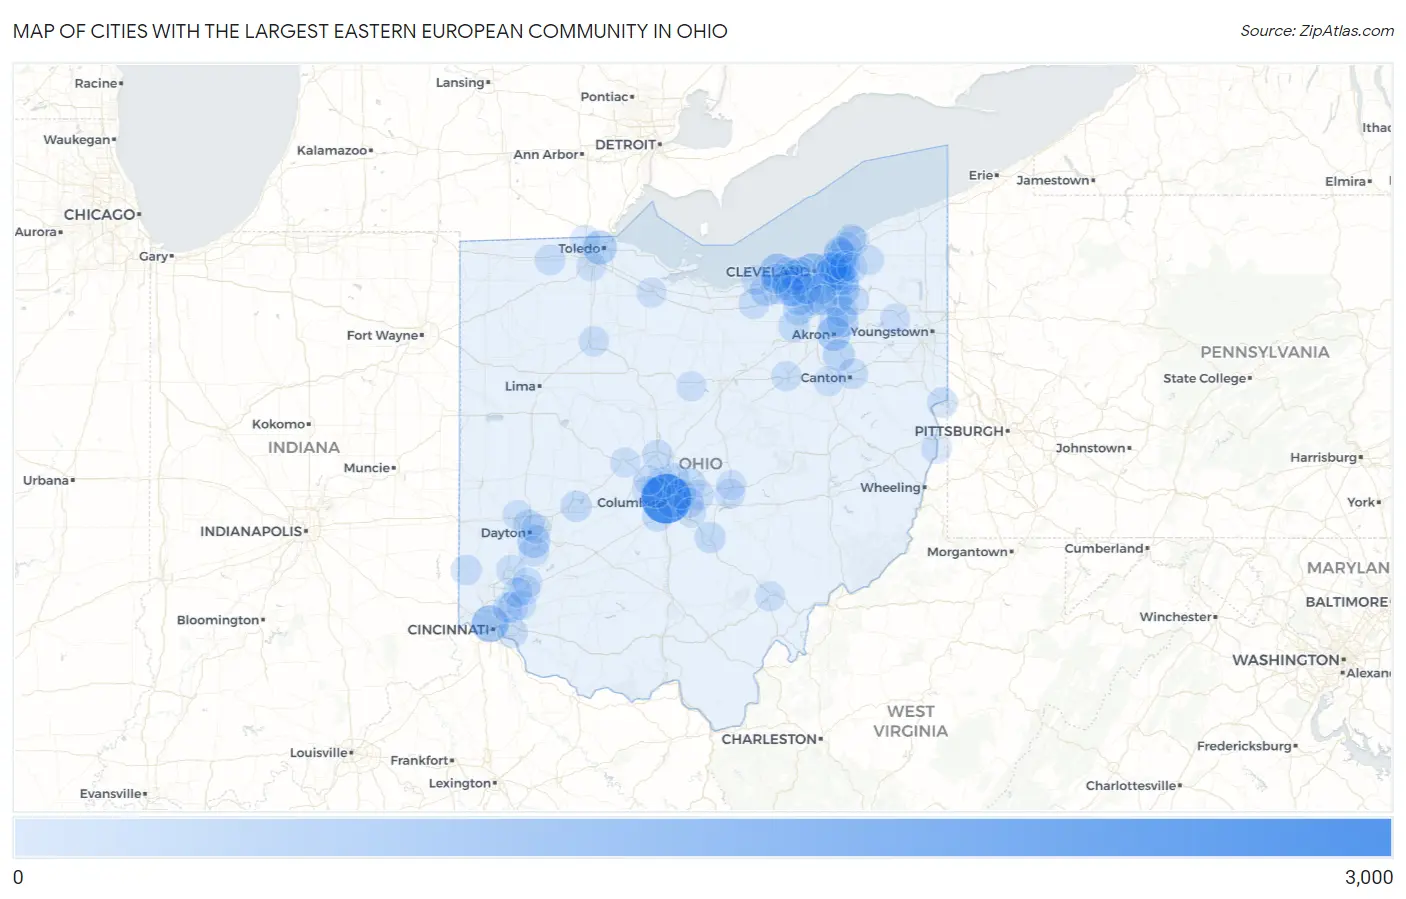
Map of Cities with the Largest Eastern European Community in Ohio
0
3,000
Cities with the Largest Eastern European Community in Ohio
| City | Eastern European | vs State | vs National | |
| 1. | Columbus | 2,550 | 38,474(6.63%)#1 | 1,005,654(0.25%)#19 |
| 2. | Cincinnati | 905 | 38,474(2.35%)#2 | 1,005,654(0.09%)#96 |
| 3. | Cleveland | 810 | 38,474(2.11%)#3 | 1,005,654(0.08%)#113 |
| 4. | Avon Lake | 718 | 38,474(1.87%)#4 | 1,005,654(0.07%)#135 |
| 5. | Solon | 558 | 38,474(1.45%)#5 | 1,005,654(0.06%)#193 |
| 6. | Akron | 544 | 38,474(1.41%)#6 | 1,005,654(0.05%)#201 |
| 7. | Toledo | 534 | 38,474(1.39%)#7 | 1,005,654(0.05%)#204 |
| 8. | Shaker Heights | 497 | 38,474(1.29%)#8 | 1,005,654(0.05%)#221 |
| 9. | Lakewood | 435 | 38,474(1.13%)#9 | 1,005,654(0.04%)#256 |
| 10. | Kettering | 420 | 38,474(1.09%)#10 | 1,005,654(0.04%)#269 |
| 11. | Bexley | 400 | 38,474(1.04%)#11 | 1,005,654(0.04%)#279 |
| 12. | Wickliffe | 390 | 38,474(1.01%)#12 | 1,005,654(0.04%)#290 |
| 13. | Cleveland Heights | 387 | 38,474(1.01%)#13 | 1,005,654(0.04%)#294 |
| 14. | Elyria | 338 | 38,474(0.88%)#14 | 1,005,654(0.03%)#346 |
| 15. | Beachwood | 329 | 38,474(0.86%)#15 | 1,005,654(0.03%)#360 |
| 16. | Westlake | 326 | 38,474(0.85%)#16 | 1,005,654(0.03%)#366 |
| 17. | North Royalton | 321 | 38,474(0.83%)#17 | 1,005,654(0.03%)#380 |
| 18. | Stow | 298 | 38,474(0.77%)#18 | 1,005,654(0.03%)#415 |
| 19. | Green | 295 | 38,474(0.77%)#19 | 1,005,654(0.03%)#425 |
| 20. | Macedonia | 250 | 38,474(0.65%)#20 | 1,005,654(0.02%)#523 |
| 21. | Westerville | 240 | 38,474(0.62%)#21 | 1,005,654(0.02%)#543 |
| 22. | Parma | 239 | 38,474(0.62%)#22 | 1,005,654(0.02%)#545 |
| 23. | Medina | 234 | 38,474(0.61%)#23 | 1,005,654(0.02%)#565 |
| 24. | Springfield | 233 | 38,474(0.61%)#24 | 1,005,654(0.02%)#568 |
| 25. | Rocky River | 224 | 38,474(0.58%)#25 | 1,005,654(0.02%)#603 |
| 26. | Willoughby Hills | 214 | 38,474(0.56%)#26 | 1,005,654(0.02%)#645 |
| 27. | University Heights | 207 | 38,474(0.54%)#27 | 1,005,654(0.02%)#665 |
| 28. | Orange | 207 | 38,474(0.54%)#28 | 1,005,654(0.02%)#667 |
| 29. | Broadview Heights | 199 | 38,474(0.52%)#29 | 1,005,654(0.02%)#702 |
| 30. | Lancaster | 198 | 38,474(0.51%)#30 | 1,005,654(0.02%)#708 |
| 31. | Lyndhurst | 198 | 38,474(0.51%)#31 | 1,005,654(0.02%)#711 |
| 32. | Hudson | 197 | 38,474(0.51%)#32 | 1,005,654(0.02%)#714 |
| 33. | Brunswick | 196 | 38,474(0.51%)#33 | 1,005,654(0.02%)#721 |
| 34. | Strongsville | 191 | 38,474(0.50%)#34 | 1,005,654(0.02%)#744 |
| 35. | Dayton | 188 | 38,474(0.49%)#35 | 1,005,654(0.02%)#756 |
| 36. | North Ridgeville | 175 | 38,474(0.45%)#36 | 1,005,654(0.02%)#813 |
| 37. | Grove City | 172 | 38,474(0.45%)#37 | 1,005,654(0.02%)#832 |
| 38. | Pepper Pike | 172 | 38,474(0.45%)#38 | 1,005,654(0.02%)#833 |
| 39. | Mayfield Heights | 170 | 38,474(0.44%)#39 | 1,005,654(0.02%)#846 |
| 40. | Moreland Hills | 170 | 38,474(0.44%)#40 | 1,005,654(0.02%)#850 |
| 41. | Highland Heights | 169 | 38,474(0.44%)#41 | 1,005,654(0.02%)#856 |
| 42. | Bay Village | 167 | 38,474(0.43%)#42 | 1,005,654(0.02%)#867 |
| 43. | Canton | 163 | 38,474(0.42%)#43 | 1,005,654(0.02%)#891 |
| 44. | New Albany | 162 | 38,474(0.42%)#44 | 1,005,654(0.02%)#897 |
| 45. | Upper Arlington | 157 | 38,474(0.41%)#45 | 1,005,654(0.02%)#921 |
| 46. | East Liverpool | 152 | 38,474(0.40%)#46 | 1,005,654(0.02%)#953 |
| 47. | Aurora | 150 | 38,474(0.39%)#47 | 1,005,654(0.01%)#963 |
| 48. | Worthington | 147 | 38,474(0.38%)#48 | 1,005,654(0.01%)#984 |
| 49. | Willoughby | 144 | 38,474(0.37%)#49 | 1,005,654(0.01%)#1,010 |
| 50. | Delaware | 143 | 38,474(0.37%)#50 | 1,005,654(0.01%)#1,016 |
| 51. | Centerville | 142 | 38,474(0.37%)#51 | 1,005,654(0.01%)#1,027 |
| 52. | Pataskala | 141 | 38,474(0.37%)#52 | 1,005,654(0.01%)#1,038 |
| 53. | Oxford | 139 | 38,474(0.36%)#53 | 1,005,654(0.01%)#1,053 |
| 54. | Oberlin | 138 | 38,474(0.36%)#54 | 1,005,654(0.01%)#1,066 |
| 55. | Independence | 138 | 38,474(0.36%)#55 | 1,005,654(0.01%)#1,067 |
| 56. | Mentor | 134 | 38,474(0.35%)#56 | 1,005,654(0.01%)#1,097 |
| 57. | Reynoldsburg | 133 | 38,474(0.35%)#57 | 1,005,654(0.01%)#1,108 |
| 58. | North Olmsted | 133 | 38,474(0.35%)#58 | 1,005,654(0.01%)#1,110 |
| 59. | Delta | 133 | 38,474(0.35%)#59 | 1,005,654(0.01%)#1,115 |
| 60. | Berea | 132 | 38,474(0.34%)#60 | 1,005,654(0.01%)#1,123 |
| 61. | Montgomery | 131 | 38,474(0.34%)#61 | 1,005,654(0.01%)#1,133 |
| 62. | Fairview Park | 130 | 38,474(0.34%)#62 | 1,005,654(0.01%)#1,138 |
| 63. | Forestville | 130 | 38,474(0.34%)#63 | 1,005,654(0.01%)#1,140 |
| 64. | Olmsted Falls | 126 | 38,474(0.33%)#64 | 1,005,654(0.01%)#1,169 |
| 65. | South Euclid | 125 | 38,474(0.32%)#65 | 1,005,654(0.01%)#1,176 |
| 66. | Parma Heights | 115 | 38,474(0.30%)#66 | 1,005,654(0.01%)#1,270 |
| 67. | Gates Mills | 113 | 38,474(0.29%)#67 | 1,005,654(0.01%)#1,302 |
| 68. | Lorain | 107 | 38,474(0.28%)#68 | 1,005,654(0.01%)#1,351 |
| 69. | Hilliard | 107 | 38,474(0.28%)#69 | 1,005,654(0.01%)#1,354 |
| 70. | Dublin | 102 | 38,474(0.27%)#70 | 1,005,654(0.01%)#1,406 |
| 71. | Blue Ash | 102 | 38,474(0.27%)#71 | 1,005,654(0.01%)#1,410 |
| 72. | Findlay | 100 | 38,474(0.26%)#72 | 1,005,654(0.01%)#1,433 |
| 73. | Wooster | 96 | 38,474(0.25%)#73 | 1,005,654(0.01%)#1,488 |
| 74. | Brecksville | 95 | 38,474(0.25%)#74 | 1,005,654(0.01%)#1,500 |
| 75. | Cuyahoga Falls | 94 | 38,474(0.24%)#75 | 1,005,654(0.01%)#1,510 |
| 76. | Middletown | 91 | 38,474(0.24%)#76 | 1,005,654(0.01%)#1,553 |
| 77. | Heath | 91 | 38,474(0.24%)#77 | 1,005,654(0.01%)#1,566 |
| 78. | Chardon | 91 | 38,474(0.24%)#78 | 1,005,654(0.01%)#1,568 |
| 79. | Avon | 88 | 38,474(0.23%)#79 | 1,005,654(0.01%)#1,602 |
| 80. | South Lebanon | 87 | 38,474(0.23%)#80 | 1,005,654(0.01%)#1,633 |
| 81. | Newton Falls | 87 | 38,474(0.23%)#81 | 1,005,654(0.01%)#1,634 |
| 82. | Sylvania | 85 | 38,474(0.22%)#82 | 1,005,654(0.01%)#1,653 |
| 83. | Mingo Junction | 83 | 38,474(0.22%)#83 | 1,005,654(0.01%)#1,685 |
| 84. | Athens | 82 | 38,474(0.21%)#84 | 1,005,654(0.01%)#1,694 |
| 85. | Marysville | 81 | 38,474(0.21%)#85 | 1,005,654(0.01%)#1,709 |
| 86. | Gahanna | 80 | 38,474(0.21%)#86 | 1,005,654(0.01%)#1,728 |
| 87. | Loveland | 80 | 38,474(0.21%)#87 | 1,005,654(0.01%)#1,734 |
| 88. | Massillon | 79 | 38,474(0.21%)#88 | 1,005,654(0.01%)#1,749 |
| 89. | Willowick | 79 | 38,474(0.21%)#89 | 1,005,654(0.01%)#1,760 |
| 90. | Mentor On The Lake | 79 | 38,474(0.21%)#90 | 1,005,654(0.01%)#1,765 |
| 91. | Pickerington | 78 | 38,474(0.20%)#91 | 1,005,654(0.01%)#1,775 |
| 92. | Fremont | 77 | 38,474(0.20%)#92 | 1,005,654(0.01%)#1,800 |
| 93. | Lebanon | 75 | 38,474(0.19%)#93 | 1,005,654(0.01%)#1,831 |
| 94. | Chesterland | 74 | 38,474(0.19%)#94 | 1,005,654(0.01%)#1,859 |
| 95. | Mason | 72 | 38,474(0.19%)#95 | 1,005,654(0.01%)#1,884 |
| 96. | Galion | 72 | 38,474(0.19%)#96 | 1,005,654(0.01%)#1,893 |
| 97. | Clayton | 70 | 38,474(0.18%)#97 | 1,005,654(0.01%)#1,944 |
| 98. | Riverside | 68 | 38,474(0.18%)#98 | 1,005,654(0.01%)#1,987 |
| 99. | Newark | 67 | 38,474(0.17%)#99 | 1,005,654(0.01%)#2,004 |
| 100. | Perrysburg | 65 | 38,474(0.17%)#100 | 1,005,654(0.01%)#2,055 |
Common Questions
What are the Top 10 Cities with the Largest Eastern European Community in Ohio?
Top 10 Cities with the Largest Eastern European Community in Ohio are:
#1
2,550
#2
905
#3
810
#4
718
#5
558
#6
544
#7
534
#8
497
#9
435
#10
420
What city has the Largest Eastern European Community in Ohio?
Columbus has the Largest Eastern European Community in Ohio with 2,550.
What is the Total Eastern European Population in the State of Ohio?
Total Eastern European Population in Ohio is 38,474.
What is the Total Eastern European Population in the United States?
Total Eastern European Population in the United States is 1,005,654.