Cities with the Largest Eastern European Community in the United States
RELATED REPORTS & OPTIONS
Eastern European
United States
Compare Cities
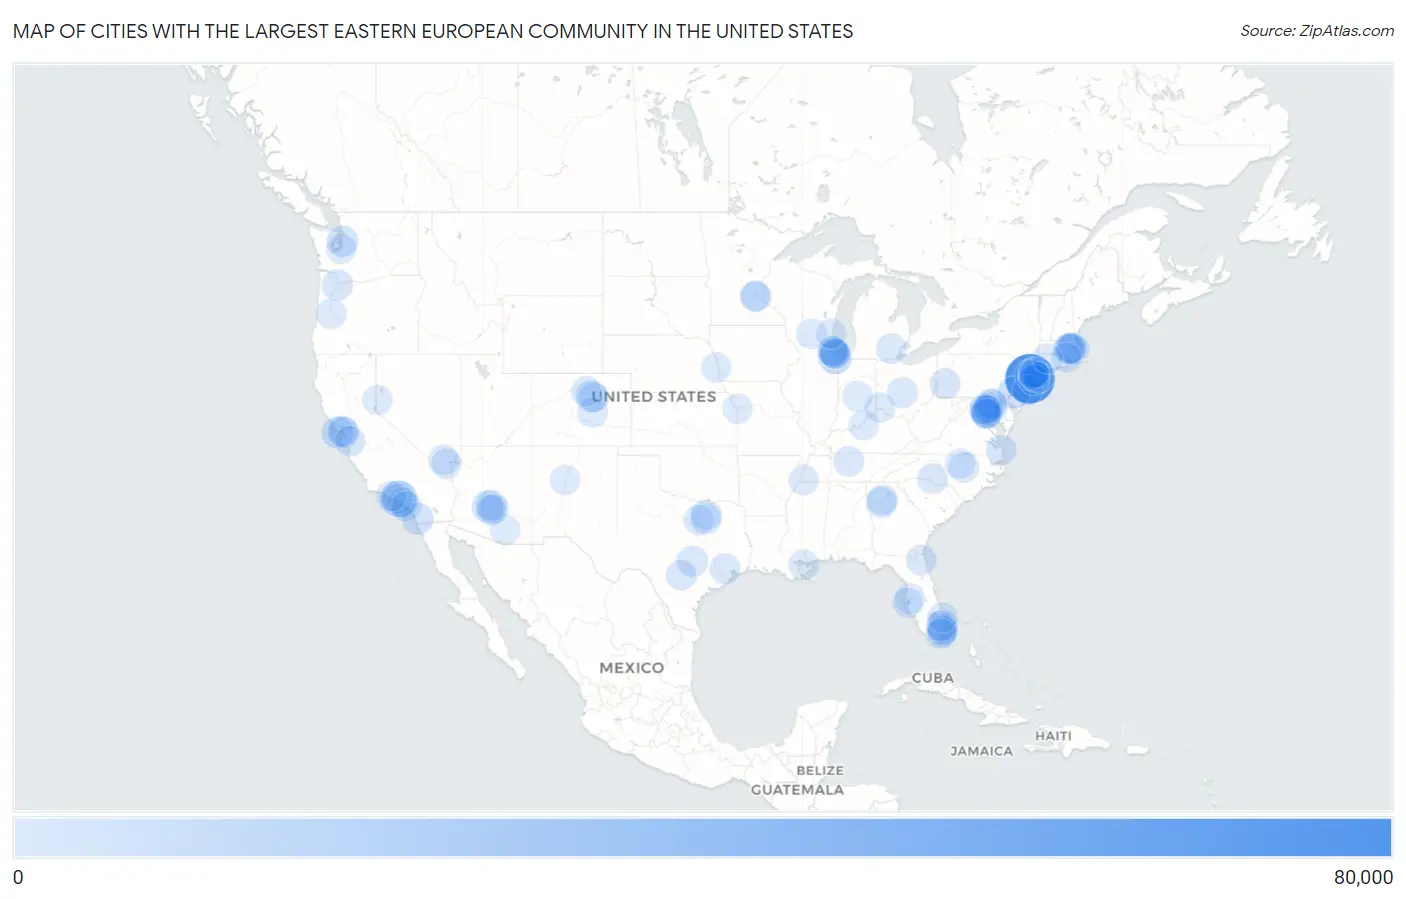
Map of Cities with the Largest Eastern European Community in the United States
0
80,000
Cities with the Largest Eastern European Community in the United States
| City | Eastern European | vs State | vs National | |
| 1. | New York | 73,403 | 148,934(49.29%)#1 | 1,005,654(7.30%)#1 |
| 2. | Los Angeles | 22,951 | 118,706(19.33%)#1 | 1,005,654(2.28%)#2 |
| 3. | Chicago | 10,875 | 42,088(25.84%)#1 | 1,005,654(1.08%)#3 |
| 4. | Philadelphia | 7,564 | 61,701(12.26%)#1 | 1,005,654(0.75%)#4 |
| 5. | Washington | 7,091 | 7,091(100.00%)#1 | 1,005,654(0.71%)#5 |
| 6. | San Francisco | 6,556 | 118,706(5.52%)#2 | 1,005,654(0.65%)#6 |
| 7. | San Diego | 6,403 | 118,706(5.39%)#3 | 1,005,654(0.64%)#7 |
| 8. | Denver | 4,807 | 21,389(22.47%)#1 | 1,005,654(0.48%)#8 |
| 9. | Seattle | 4,662 | 21,487(21.70%)#1 | 1,005,654(0.46%)#9 |
| 10. | Phoenix | 4,574 | 18,556(24.65%)#1 | 1,005,654(0.45%)#10 |
| 11. | Boston | 4,280 | 39,939(10.72%)#1 | 1,005,654(0.43%)#11 |
| 12. | Newton | 3,757 | 39,939(9.41%)#2 | 1,005,654(0.37%)#12 |
| 13. | Austin | 3,656 | 34,818(10.50%)#1 | 1,005,654(0.36%)#13 |
| 14. | Portland | 3,572 | 15,869(22.51%)#1 | 1,005,654(0.36%)#14 |
| 15. | Pittsburgh | 2,929 | 61,701(4.75%)#2 | 1,005,654(0.29%)#15 |
| 16. | Bethesda | 2,821 | 34,084(8.28%)#1 | 1,005,654(0.28%)#16 |
| 17. | Dallas | 2,778 | 34,818(7.98%)#2 | 1,005,654(0.28%)#17 |
| 18. | Oakland | 2,705 | 118,706(2.28%)#4 | 1,005,654(0.27%)#18 |
| 19. | Columbus | 2,550 | 38,474(6.63%)#1 | 1,005,654(0.25%)#19 |
| 20. | Houston | 2,506 | 34,818(7.20%)#3 | 1,005,654(0.25%)#20 |
| 21. | Baltimore | 2,324 | 34,084(6.82%)#2 | 1,005,654(0.23%)#21 |
| 22. | Plainview | 2,282 | 148,934(1.53%)#2 | 1,005,654(0.23%)#22 |
| 23. | Atlanta | 2,273 | 21,258(10.69%)#1 | 1,005,654(0.23%)#23 |
| 24. | Arlington | 2,187 | 24,666(8.87%)#1 | 1,005,654(0.22%)#24 |
| 25. | Minneapolis | 2,090 | 15,160(13.79%)#1 | 1,005,654(0.21%)#25 |
| 26. | Nashville | 2,066 | 10,773(19.18%)#1 | 1,005,654(0.21%)#26 |
| 27. | Boca Raton | 1,967 | 68,972(2.85%)#1 | 1,005,654(0.20%)#27 |
| 28. | Berkeley | 1,948 | 118,706(1.64%)#5 | 1,005,654(0.19%)#28 |
| 29. | Virginia Beach | 1,846 | 24,666(7.48%)#2 | 1,005,654(0.18%)#29 |
| 30. | Cambridge | 1,831 | 39,939(4.58%)#3 | 1,005,654(0.18%)#30 |
| 31. | Pikesville | 1,811 | 34,084(5.31%)#3 | 1,005,654(0.18%)#31 |
| 32. | San Antonio | 1,790 | 34,818(5.14%)#4 | 1,005,654(0.18%)#32 |
| 33. | Scottsdale | 1,764 | 18,556(9.51%)#2 | 1,005,654(0.18%)#33 |
| 34. | Brookline | 1,737 | 39,939(4.35%)#4 | 1,005,654(0.17%)#34 |
| 35. | Sandy Springs | 1,700 | 21,258(8.00%)#2 | 1,005,654(0.17%)#35 |
| 36. | Charlotte | 1,696 | 19,849(8.54%)#1 | 1,005,654(0.17%)#36 |
| 37. | San Jose | 1,694 | 118,706(1.43%)#6 | 1,005,654(0.17%)#37 |
| 38. | Santa Monica | 1,627 | 118,706(1.37%)#7 | 1,005,654(0.16%)#38 |
| 39. | Las Vegas | 1,606 | 6,792(23.65%)#1 | 1,005,654(0.16%)#39 |
| 40. | Ann Arbor | 1,599 | 28,976(5.52%)#1 | 1,005,654(0.16%)#40 |
| 41. | Jacksonville | 1,596 | 68,972(2.31%)#2 | 1,005,654(0.16%)#41 |
| 42. | Rockville | 1,578 | 34,084(4.63%)#4 | 1,005,654(0.16%)#42 |
| 43. | Potomac | 1,430 | 34,084(4.20%)#5 | 1,005,654(0.14%)#43 |
| 44. | Tucson | 1,428 | 18,556(7.70%)#3 | 1,005,654(0.14%)#44 |
| 45. | Highland Park | 1,420 | 42,088(3.37%)#2 | 1,005,654(0.14%)#45 |
| 46. | Madison | 1,365 | 13,275(10.28%)#1 | 1,005,654(0.14%)#46 |
| 47. | Raleigh | 1,338 | 19,849(6.74%)#2 | 1,005,654(0.13%)#47 |
| 48. | Northbrook | 1,329 | 42,088(3.16%)#3 | 1,005,654(0.13%)#48 |
| 49. | Stamford | 1,322 | 20,210(6.54%)#1 | 1,005,654(0.13%)#49 |
| 50. | Hollywood | 1,319 | 68,972(1.91%)#3 | 1,005,654(0.13%)#50 |
| 51. | Englewood | 1,275 | 60,875(2.09%)#1 | 1,005,654(0.13%)#51 |
| 52. | Needham | 1,240 | 39,939(3.10%)#5 | 1,005,654(0.12%)#52 |
| 53. | Columbia | 1,236 | 34,084(3.63%)#6 | 1,005,654(0.12%)#53 |
| 54. | Indianapolis | 1,233 | 11,800(10.45%)#1 | 1,005,654(0.12%)#54 |
| 55. | Albuquerque | 1,229 | 4,107(29.92%)#1 | 1,005,654(0.12%)#55 |
| 56. | Evanston | 1,221 | 42,088(2.90%)#4 | 1,005,654(0.12%)#56 |
| 57. | Durham | 1,163 | 19,849(5.86%)#3 | 1,005,654(0.12%)#57 |
| 58. | New Rochelle | 1,128 | 148,934(0.76%)#3 | 1,005,654(0.11%)#58 |
| 59. | Mesa | 1,127 | 18,556(6.07%)#4 | 1,005,654(0.11%)#59 |
| 60. | Melville | 1,121 | 148,934(0.75%)#4 | 1,005,654(0.11%)#60 |
| 61. | Colorado Springs | 1,120 | 21,389(5.24%)#2 | 1,005,654(0.11%)#61 |
| 62. | Deerfield | 1,118 | 42,088(2.66%)#5 | 1,005,654(0.11%)#62 |
| 63. | Louisville | 1,117 | 5,523(20.22%)#1 | 1,005,654(0.11%)#63 |
| 64. | Lakewood | 1,100 | 60,875(1.81%)#2 | 1,005,654(0.11%)#64 |
| 65. | Long Beach | 1,090 | 118,706(0.92%)#8 | 1,005,654(0.11%)#65 |
| 66. | Fort Lauderdale | 1,089 | 68,972(1.58%)#4 | 1,005,654(0.11%)#66 |
| 67. | New Orleans | 1,084 | 4,171(25.99%)#1 | 1,005,654(0.11%)#67 |
| 68. | Henderson | 1,060 | 6,792(15.61%)#2 | 1,005,654(0.11%)#68 |
| 69. | Eugene | 1,054 | 15,869(6.64%)#2 | 1,005,654(0.10%)#69 |
| 70. | Reno | 1,050 | 6,792(15.46%)#3 | 1,005,654(0.10%)#70 |
| 71. | Tempe | 1,047 | 18,556(5.64%)#5 | 1,005,654(0.10%)#71 |
| 72. | Thousand Oaks | 1,044 | 118,706(0.88%)#9 | 1,005,654(0.10%)#72 |
| 73. | Coral Springs | 1,040 | 68,972(1.51%)#5 | 1,005,654(0.10%)#73 |
| 74. | Plano | 1,035 | 34,818(2.97%)#5 | 1,005,654(0.10%)#74 |
| 75. | Skokie | 1,034 | 42,088(2.46%)#6 | 1,005,654(0.10%)#75 |
| 76. | White Plains | 1,034 | 148,934(0.69%)#5 | 1,005,654(0.10%)#76 |
| 77. | Providence | 1,030 | 4,058(25.38%)#1 | 1,005,654(0.10%)#77 |
| 78. | Woodmere | 1,026 | 148,934(0.69%)#6 | 1,005,654(0.10%)#78 |
| 79. | Tampa | 1,023 | 68,972(1.48%)#6 | 1,005,654(0.10%)#79 |
| 80. | Milwaukee | 1,015 | 13,275(7.65%)#2 | 1,005,654(0.10%)#80 |
| 81. | Aurora | 1,004 | 21,389(4.69%)#3 | 1,005,654(0.10%)#81 |
| 82. | Boulder | 996 | 21,389(4.66%)#4 | 1,005,654(0.10%)#82 |
| 83. | Fort Worth | 985 | 34,818(2.83%)#6 | 1,005,654(0.10%)#83 |
| 84. | Kansas City | 982 | 12,202(8.05%)#1 | 1,005,654(0.10%)#84 |
| 85. | Silver Spring | 980 | 34,084(2.88%)#7 | 1,005,654(0.10%)#85 |
| 86. | Glen Rock Borough | 974 | 60,875(1.60%)#3 | 1,005,654(0.10%)#86 |
| 87. | Tacoma | 967 | 21,487(4.50%)#2 | 1,005,654(0.10%)#87 |
| 88. | Newport Beach | 966 | 118,706(0.81%)#10 | 1,005,654(0.10%)#88 |
| 89. | Memphis | 952 | 10,773(8.84%)#2 | 1,005,654(0.09%)#89 |
| 90. | Aventura | 941 | 68,972(1.36%)#7 | 1,005,654(0.09%)#90 |
| 91. | St Louis Park | 937 | 15,160(6.18%)#2 | 1,005,654(0.09%)#91 |
| 92. | St Petersburg | 926 | 68,972(1.34%)#8 | 1,005,654(0.09%)#92 |
| 93. | Omaha | 920 | 2,987(30.80%)#1 | 1,005,654(0.09%)#93 |
| 94. | Palm Beach Gardens | 912 | 68,972(1.32%)#9 | 1,005,654(0.09%)#94 |
| 95. | Miami | 905 | 68,972(1.31%)#10 | 1,005,654(0.09%)#95 |
| 96. | Cincinnati | 905 | 38,474(2.35%)#2 | 1,005,654(0.09%)#96 |
| 97. | Scarsdale | 902 | 148,934(0.61%)#7 | 1,005,654(0.09%)#97 |
| 98. | Port Washington | 894 | 148,934(0.60%)#8 | 1,005,654(0.09%)#98 |
| 99. | West Hartford | 883 | 20,210(4.37%)#2 | 1,005,654(0.09%)#99 |
| 100. | Alexandria | 874 | 24,666(3.54%)#3 | 1,005,654(0.09%)#100 |
Common Questions
What are the Top 10 Cities with the Largest Eastern European Community in the United States?
Top 10 Cities with the Largest Eastern European Community in the United States are:
#1
73,403
#2
22,951
#3
10,875
#4
7,564
#5
7,091
#6
6,556
#7
6,403
#8
4,807
#9
4,662
#10
4,574
What city has the Largest Eastern European Community in the United States?
New York has the Largest Eastern European Community in the United States with 73,403.
What is the Total Eastern European Population in the United States?
Total Eastern European Population in the United States is 1,005,654.