Cities with the Largest Eastern European Community in Illinois
RELATED REPORTS & OPTIONS
Eastern European
Illinois
Compare Cities
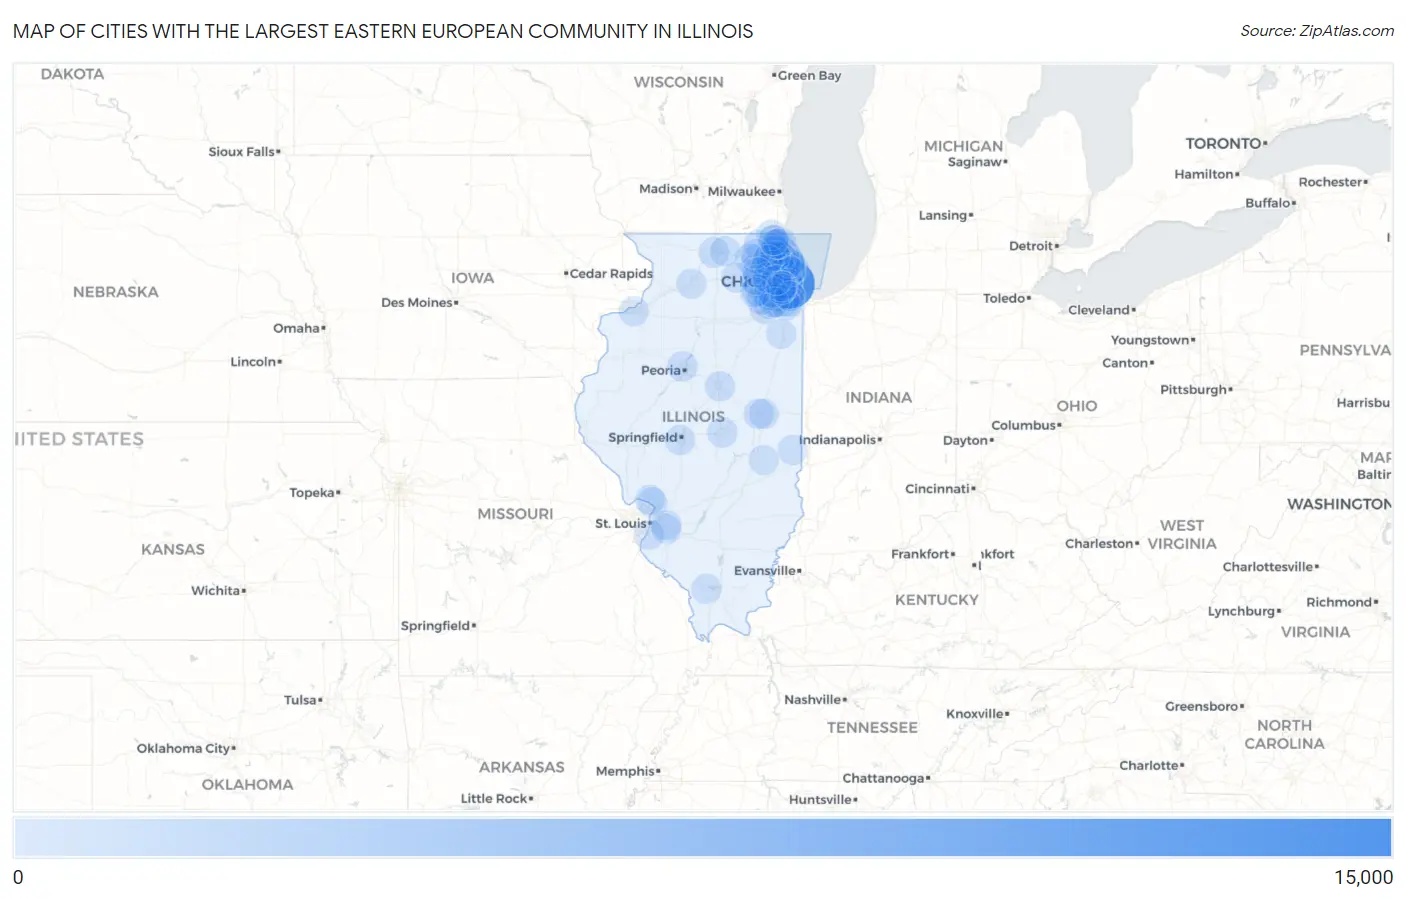
Map of Cities with the Largest Eastern European Community in Illinois
0
15,000
Cities with the Largest Eastern European Community in Illinois
| City | Eastern European | vs State | vs National | |
| 1. | Chicago | 10,875 | 42,088(25.84%)#1 | 1,005,654(1.08%)#3 |
| 2. | Highland Park | 1,420 | 42,088(3.37%)#2 | 1,005,654(0.14%)#45 |
| 3. | Northbrook | 1,329 | 42,088(3.16%)#3 | 1,005,654(0.13%)#48 |
| 4. | Evanston | 1,221 | 42,088(2.90%)#4 | 1,005,654(0.12%)#56 |
| 5. | Deerfield | 1,118 | 42,088(2.66%)#5 | 1,005,654(0.11%)#62 |
| 6. | Skokie | 1,034 | 42,088(2.46%)#6 | 1,005,654(0.10%)#75 |
| 7. | Buffalo Grove | 844 | 42,088(2.01%)#7 | 1,005,654(0.08%)#104 |
| 8. | Glenview | 548 | 42,088(1.30%)#8 | 1,005,654(0.05%)#199 |
| 9. | Naperville | 534 | 42,088(1.27%)#9 | 1,005,654(0.05%)#205 |
| 10. | Hawthorn Woods | 491 | 42,088(1.17%)#10 | 1,005,654(0.05%)#223 |
| 11. | Aurora | 465 | 42,088(1.10%)#11 | 1,005,654(0.05%)#232 |
| 12. | Arlington Heights | 401 | 42,088(0.95%)#12 | 1,005,654(0.04%)#278 |
| 13. | Rolling Meadows | 370 | 42,088(0.88%)#13 | 1,005,654(0.04%)#310 |
| 14. | Wheaton | 335 | 42,088(0.80%)#14 | 1,005,654(0.03%)#352 |
| 15. | Downers Grove | 332 | 42,088(0.79%)#15 | 1,005,654(0.03%)#357 |
| 16. | Joliet | 317 | 42,088(0.75%)#16 | 1,005,654(0.03%)#382 |
| 17. | Glencoe | 312 | 42,088(0.74%)#17 | 1,005,654(0.03%)#391 |
| 18. | Vernon Hills | 309 | 42,088(0.73%)#18 | 1,005,654(0.03%)#398 |
| 19. | Lake Forest | 299 | 42,088(0.71%)#19 | 1,005,654(0.03%)#413 |
| 20. | Oak Park | 296 | 42,088(0.70%)#20 | 1,005,654(0.03%)#422 |
| 21. | Wilmette | 296 | 42,088(0.70%)#21 | 1,005,654(0.03%)#423 |
| 22. | Peoria | 288 | 42,088(0.68%)#22 | 1,005,654(0.03%)#434 |
| 23. | Waukegan | 268 | 42,088(0.64%)#23 | 1,005,654(0.03%)#479 |
| 24. | Clarendon Hills | 260 | 42,088(0.62%)#24 | 1,005,654(0.03%)#495 |
| 25. | Westmont | 255 | 42,088(0.61%)#25 | 1,005,654(0.03%)#506 |
| 26. | Champaign | 235 | 42,088(0.56%)#26 | 1,005,654(0.02%)#558 |
| 27. | Lisle | 232 | 42,088(0.55%)#27 | 1,005,654(0.02%)#573 |
| 28. | Rockford | 223 | 42,088(0.53%)#28 | 1,005,654(0.02%)#609 |
| 29. | Elgin | 220 | 42,088(0.52%)#29 | 1,005,654(0.02%)#619 |
| 30. | Crest Hill | 219 | 42,088(0.52%)#30 | 1,005,654(0.02%)#624 |
| 31. | Orland Park | 216 | 42,088(0.51%)#31 | 1,005,654(0.02%)#636 |
| 32. | Huntley | 197 | 42,088(0.47%)#32 | 1,005,654(0.02%)#713 |
| 33. | Springfield | 196 | 42,088(0.47%)#33 | 1,005,654(0.02%)#718 |
| 34. | Oak Forest | 188 | 42,088(0.45%)#34 | 1,005,654(0.02%)#758 |
| 35. | Cortland | 173 | 42,088(0.41%)#35 | 1,005,654(0.02%)#827 |
| 36. | Decatur | 172 | 42,088(0.41%)#36 | 1,005,654(0.02%)#829 |
| 37. | Mchenry | 171 | 42,088(0.41%)#37 | 1,005,654(0.02%)#840 |
| 38. | Hoffman Estates | 165 | 42,088(0.39%)#38 | 1,005,654(0.02%)#877 |
| 39. | Elmhurst | 165 | 42,088(0.39%)#39 | 1,005,654(0.02%)#878 |
| 40. | Lincolnshire | 165 | 42,088(0.39%)#40 | 1,005,654(0.02%)#883 |
| 41. | Bloomington | 163 | 42,088(0.39%)#41 | 1,005,654(0.02%)#890 |
| 42. | Riverwoods | 161 | 42,088(0.38%)#42 | 1,005,654(0.02%)#903 |
| 43. | Libertyville | 157 | 42,088(0.37%)#43 | 1,005,654(0.02%)#926 |
| 44. | Palatine | 154 | 42,088(0.37%)#44 | 1,005,654(0.02%)#942 |
| 45. | Lombard | 151 | 42,088(0.36%)#45 | 1,005,654(0.02%)#955 |
| 46. | Park Ridge | 151 | 42,088(0.36%)#46 | 1,005,654(0.02%)#956 |
| 47. | La Grange Park | 149 | 42,088(0.35%)#47 | 1,005,654(0.01%)#972 |
| 48. | Oak Lawn | 146 | 42,088(0.35%)#48 | 1,005,654(0.01%)#988 |
| 49. | Schaumburg | 144 | 42,088(0.34%)#49 | 1,005,654(0.01%)#1,003 |
| 50. | Urbana | 140 | 42,088(0.33%)#50 | 1,005,654(0.01%)#1,044 |
| 51. | Wheeling | 139 | 42,088(0.33%)#51 | 1,005,654(0.01%)#1,052 |
| 52. | Morton Grove | 137 | 42,088(0.33%)#52 | 1,005,654(0.01%)#1,072 |
| 53. | Glen Ellyn | 135 | 42,088(0.32%)#53 | 1,005,654(0.01%)#1,087 |
| 54. | Lemont | 135 | 42,088(0.32%)#54 | 1,005,654(0.01%)#1,090 |
| 55. | Burr Ridge | 135 | 42,088(0.32%)#55 | 1,005,654(0.01%)#1,091 |
| 56. | Des Plaines | 134 | 42,088(0.32%)#56 | 1,005,654(0.01%)#1,094 |
| 57. | Batavia | 133 | 42,088(0.32%)#57 | 1,005,654(0.01%)#1,111 |
| 58. | Tinley Park | 131 | 42,088(0.31%)#58 | 1,005,654(0.01%)#1,127 |
| 59. | Mundelein | 131 | 42,088(0.31%)#59 | 1,005,654(0.01%)#1,129 |
| 60. | Bolingbrook | 130 | 42,088(0.31%)#60 | 1,005,654(0.01%)#1,135 |
| 61. | Berwyn | 129 | 42,088(0.31%)#61 | 1,005,654(0.01%)#1,145 |
| 62. | Lincolnwood | 127 | 42,088(0.30%)#62 | 1,005,654(0.01%)#1,164 |
| 63. | Winnetka | 122 | 42,088(0.29%)#63 | 1,005,654(0.01%)#1,206 |
| 64. | Grayslake | 116 | 42,088(0.28%)#64 | 1,005,654(0.01%)#1,256 |
| 65. | Lake Zurich | 116 | 42,088(0.28%)#65 | 1,005,654(0.01%)#1,257 |
| 66. | Moline | 113 | 42,088(0.27%)#66 | 1,005,654(0.01%)#1,293 |
| 67. | Venetian Village | 109 | 42,088(0.26%)#67 | 1,005,654(0.01%)#1,338 |
| 68. | Streamwood | 106 | 42,088(0.25%)#68 | 1,005,654(0.01%)#1,366 |
| 69. | Alton | 105 | 42,088(0.25%)#69 | 1,005,654(0.01%)#1,380 |
| 70. | Algonquin | 102 | 42,088(0.24%)#70 | 1,005,654(0.01%)#1,407 |
| 71. | Plainfield | 99 | 42,088(0.24%)#71 | 1,005,654(0.01%)#1,452 |
| 72. | Homer Glen | 98 | 42,088(0.23%)#72 | 1,005,654(0.01%)#1,469 |
| 73. | Columbia | 96 | 42,088(0.23%)#73 | 1,005,654(0.01%)#1,489 |
| 74. | Long Grove | 96 | 42,088(0.23%)#74 | 1,005,654(0.01%)#1,490 |
| 75. | La Grange | 94 | 42,088(0.22%)#75 | 1,005,654(0.01%)#1,518 |
| 76. | Woodridge | 92 | 42,088(0.22%)#76 | 1,005,654(0.01%)#1,540 |
| 77. | Geneva | 92 | 42,088(0.22%)#77 | 1,005,654(0.01%)#1,545 |
| 78. | Antioch | 92 | 42,088(0.22%)#78 | 1,005,654(0.01%)#1,546 |
| 79. | Carol Stream | 91 | 42,088(0.22%)#79 | 1,005,654(0.01%)#1,557 |
| 80. | Gurnee | 91 | 42,088(0.22%)#80 | 1,005,654(0.01%)#1,561 |
| 81. | O Fallon | 88 | 42,088(0.21%)#81 | 1,005,654(0.01%)#1,599 |
| 82. | Lockport | 88 | 42,088(0.21%)#82 | 1,005,654(0.01%)#1,601 |
| 83. | Paris | 88 | 42,088(0.21%)#83 | 1,005,654(0.01%)#1,607 |
| 84. | Barrington | 87 | 42,088(0.21%)#84 | 1,005,654(0.01%)#1,627 |
| 85. | Western Springs | 84 | 42,088(0.20%)#85 | 1,005,654(0.01%)#1,665 |
| 86. | Godfrey | 83 | 42,088(0.20%)#86 | 1,005,654(0.01%)#1,679 |
| 87. | Lindenhurst | 81 | 42,088(0.19%)#87 | 1,005,654(0.01%)#1,713 |
| 88. | Shiloh | 81 | 42,088(0.19%)#88 | 1,005,654(0.01%)#1,714 |
| 89. | Crystal Lake | 77 | 42,088(0.18%)#89 | 1,005,654(0.01%)#1,792 |
| 90. | South Elgin | 76 | 42,088(0.18%)#90 | 1,005,654(0.01%)#1,816 |
| 91. | Gages Lake | 76 | 42,088(0.18%)#91 | 1,005,654(0.01%)#1,819 |
| 92. | Dixon | 74 | 42,088(0.18%)#92 | 1,005,654(0.01%)#1,850 |
| 93. | Carbondale | 73 | 42,088(0.17%)#93 | 1,005,654(0.01%)#1,867 |
| 94. | Alsip | 73 | 42,088(0.17%)#94 | 1,005,654(0.01%)#1,870 |
| 95. | Belvidere | 72 | 42,088(0.17%)#95 | 1,005,654(0.01%)#1,886 |
| 96. | Indian Head Park | 71 | 42,088(0.17%)#96 | 1,005,654(0.01%)#1,926 |
| 97. | Villa Park | 69 | 42,088(0.16%)#97 | 1,005,654(0.01%)#1,961 |
| 98. | Montgomery | 69 | 42,088(0.16%)#98 | 1,005,654(0.01%)#1,962 |
| 99. | Bourbonnais | 69 | 42,088(0.16%)#99 | 1,005,654(0.01%)#1,964 |
| 100. | Charleston | 69 | 42,088(0.16%)#100 | 1,005,654(0.01%)#1,965 |
Common Questions
What are the Top 10 Cities with the Largest Eastern European Community in Illinois?
Top 10 Cities with the Largest Eastern European Community in Illinois are:
#1
10,875
#2
1,420
#3
1,329
#4
1,221
#5
1,118
#6
1,034
#7
844
#8
548
#9
534
#10
491
What city has the Largest Eastern European Community in Illinois?
Chicago has the Largest Eastern European Community in Illinois with 10,875.
What is the Total Eastern European Population in the State of Illinois?
Total Eastern European Population in Illinois is 42,088.
What is the Total Eastern European Population in the United States?
Total Eastern European Population in the United States is 1,005,654.