Cities with the Highest Percentage of Egyptian Population in New York
RELATED REPORTS & OPTIONS
Egyptian
New York
Compare Cities
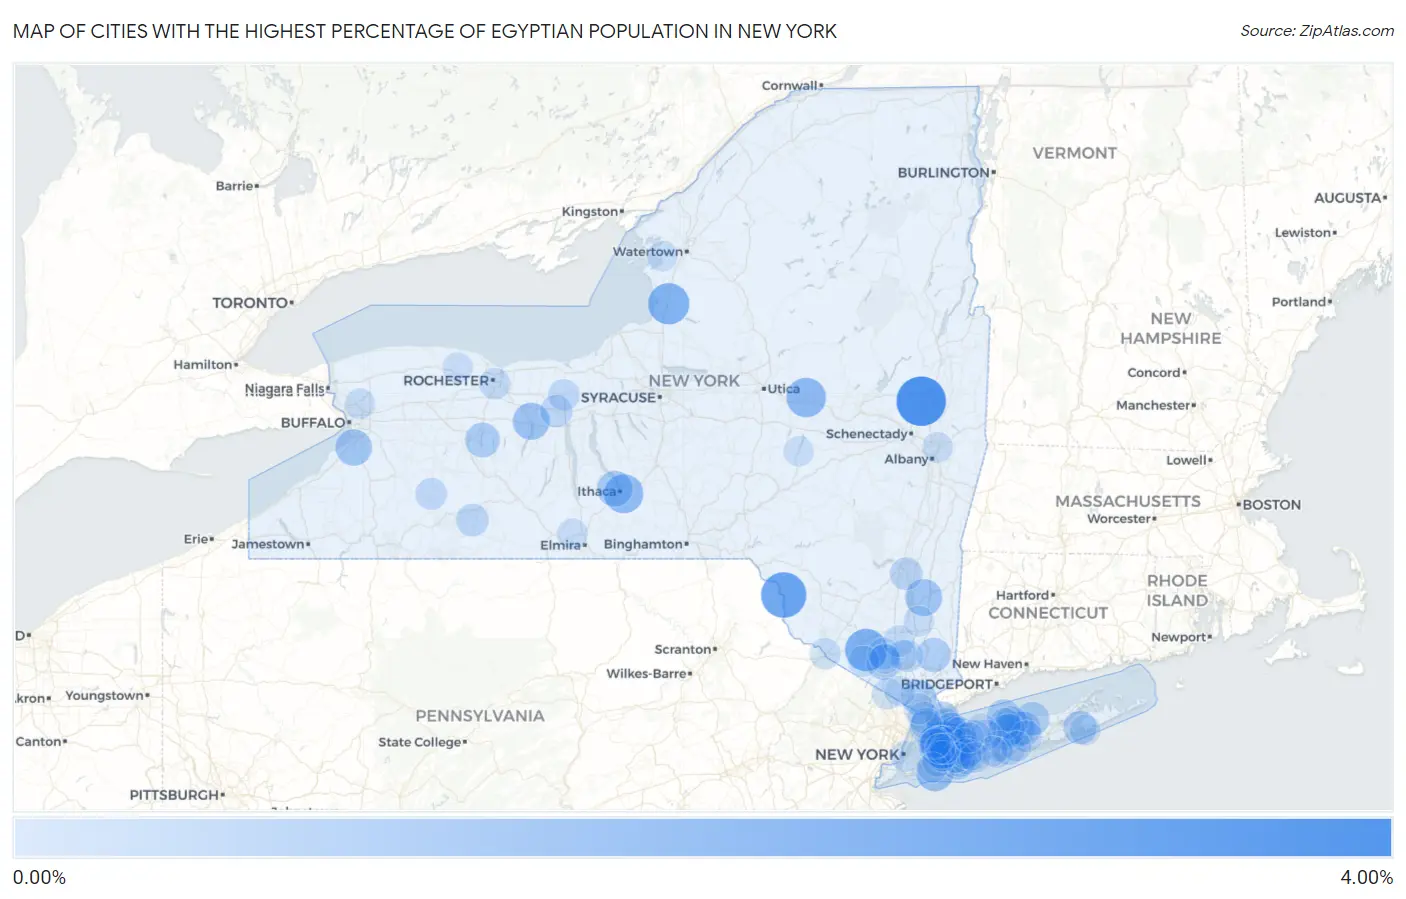
Map of Cities with the Highest Percentage of Egyptian Population in New York
0.00%
4.00%
Cities with the Highest Percentage of Egyptian Population in New York
| City | Egyptian | vs State | vs National | |
| 1. | North Ballston Spa | 3.98% | 0.20%(+3.78)#1 | 0.093%(+3.88)#32 |
| 2. | Searingtown | 3.38% | 0.20%(+3.19)#2 | 0.093%(+3.29)#36 |
| 3. | Callicoon | 3.11% | 0.20%(+2.91)#3 | 0.093%(+3.02)#40 |
| 4. | Roessleville | 2.68% | 0.20%(+2.48)#4 | 0.093%(+2.58)#54 |
| 5. | Goshen | 2.51% | 0.20%(+2.31)#5 | 0.093%(+2.42)#64 |
| 6. | Lacona | 2.30% | 0.20%(+2.11)#6 | 0.093%(+2.21)#73 |
| 7. | Little Falls | 1.96% | 0.20%(+1.76)#7 | 0.093%(+1.86)#88 |
| 8. | East Ithaca | 1.87% | 0.20%(+1.68)#8 | 0.093%(+1.78)#97 |
| 9. | Atlantic Beach | 1.59% | 0.20%(+1.39)#9 | 0.093%(+1.50)#123 |
| 10. | Canandaigua | 1.47% | 0.20%(+1.27)#10 | 0.093%(+1.37)#137 |
| 11. | Pleasant Valley | 1.46% | 0.20%(+1.26)#11 | 0.093%(+1.37)#138 |
| 12. | Hamburg | 1.35% | 0.20%(+1.16)#12 | 0.093%(+1.26)#155 |
| 13. | Northwest Ithaca | 1.22% | 0.20%(+1.03)#13 | 0.093%(+1.13)#170 |
| 14. | New Cassel | 1.19% | 0.20%(+0.993)#14 | 0.093%(+1.10)#178 |
| 15. | Glen Cove | 1.17% | 0.20%(+0.973)#15 | 0.093%(+1.08)#181 |
| 16. | South Huntington | 1.07% | 0.20%(+0.871)#16 | 0.093%(+0.974)#203 |
| 17. | Sleepy Hollow | 1.06% | 0.20%(+0.862)#17 | 0.093%(+0.965)#206 |
| 18. | Monroe | 1.04% | 0.20%(+0.844)#18 | 0.093%(+0.947)#211 |
| 19. | Conesus Lake | 1.04% | 0.20%(+0.842)#19 | 0.093%(+0.946)#212 |
| 20. | Coram | 1.02% | 0.20%(+0.828)#20 | 0.093%(+0.931)#216 |
| 21. | Lake Grove | 1.02% | 0.20%(+0.825)#21 | 0.093%(+0.928)#218 |
| 22. | Rye | 0.96% | 0.20%(+0.764)#22 | 0.093%(+0.867)#238 |
| 23. | Syosset | 0.95% | 0.20%(+0.755)#23 | 0.093%(+0.858)#244 |
| 24. | Mahopac | 0.93% | 0.20%(+0.738)#24 | 0.093%(+0.841)#251 |
| 25. | Middle Island | 0.93% | 0.20%(+0.735)#25 | 0.093%(+0.838)#252 |
| 26. | Upper Brookville | 0.90% | 0.20%(+0.708)#26 | 0.093%(+0.811)#261 |
| 27. | Bellmore | 0.89% | 0.20%(+0.694)#27 | 0.093%(+0.798)#268 |
| 28. | Old Field | 0.88% | 0.20%(+0.686)#28 | 0.093%(+0.789)#271 |
| 29. | East Shoreham | 0.84% | 0.20%(+0.645)#29 | 0.093%(+0.748)#284 |
| 30. | Shinnecock Hills | 0.80% | 0.20%(+0.600)#30 | 0.093%(+0.703)#298 |
| 31. | Pelham Manor | 0.72% | 0.20%(+0.525)#31 | 0.093%(+0.628)#330 |
| 32. | Port Jefferson Station | 0.70% | 0.20%(+0.506)#32 | 0.093%(+0.609)#336 |
| 33. | Sayville | 0.66% | 0.20%(+0.460)#33 | 0.093%(+0.563)#369 |
| 34. | Port Ewen | 0.64% | 0.20%(+0.443)#34 | 0.093%(+0.546)#381 |
| 35. | Alfred | 0.61% | 0.20%(+0.415)#35 | 0.093%(+0.518)#402 |
| 36. | Garden City Park | 0.59% | 0.20%(+0.395)#36 | 0.093%(+0.498)#417 |
| 37. | Great Neck Estates | 0.54% | 0.20%(+0.348)#37 | 0.093%(+0.452)#461 |
| 38. | Phelps | 0.54% | 0.20%(+0.346)#38 | 0.093%(+0.449)#462 |
| 39. | Bard College | 0.53% | 0.20%(+0.337)#39 | 0.093%(+0.440)#468 |
| 40. | Locust Valley | 0.53% | 0.20%(+0.330)#40 | 0.093%(+0.433)#473 |
| 41. | Centereach | 0.52% | 0.20%(+0.327)#41 | 0.093%(+0.430)#475 |
| 42. | Salisbury | 0.52% | 0.20%(+0.324)#42 | 0.093%(+0.428)#477 |
| 43. | North Merrick | 0.51% | 0.20%(+0.312)#43 | 0.093%(+0.415)#485 |
| 44. | Old Westbury | 0.50% | 0.20%(+0.302)#44 | 0.093%(+0.405)#492 |
| 45. | Yaphank | 0.50% | 0.20%(+0.301)#45 | 0.093%(+0.404)#494 |
| 46. | Highland Falls | 0.46% | 0.20%(+0.260)#46 | 0.093%(+0.364)#531 |
| 47. | Houghton | 0.45% | 0.20%(+0.255)#47 | 0.093%(+0.358)#542 |
| 48. | Lyons | 0.45% | 0.20%(+0.249)#48 | 0.093%(+0.352)#553 |
| 49. | South Blooming Grove | 0.44% | 0.20%(+0.244)#49 | 0.093%(+0.347)#557 |
| 50. | Stony Brook University | 0.43% | 0.20%(+0.237)#50 | 0.093%(+0.341)#564 |
| 51. | Tuckahoe | 0.43% | 0.20%(+0.232)#51 | 0.093%(+0.335)#571 |
| 52. | Wantagh | 0.43% | 0.20%(+0.231)#52 | 0.093%(+0.334)#572 |
| 53. | Vails Gate | 0.42% | 0.20%(+0.220)#53 | 0.093%(+0.323)#581 |
| 54. | Pelham | 0.41% | 0.20%(+0.217)#54 | 0.093%(+0.320)#586 |
| 55. | Oyster Bay Cove | 0.41% | 0.20%(+0.215)#55 | 0.093%(+0.319)#591 |
| 56. | Suffern | 0.40% | 0.20%(+0.199)#56 | 0.093%(+0.302)#607 |
| 57. | Garden City | 0.39% | 0.20%(+0.193)#57 | 0.093%(+0.296)#619 |
| 58. | Brighton | 0.39% | 0.20%(+0.192)#58 | 0.093%(+0.295)#621 |
| 59. | Plainview | 0.38% | 0.20%(+0.183)#59 | 0.093%(+0.286)#639 |
| 60. | Munsey Park | 0.36% | 0.20%(+0.162)#60 | 0.093%(+0.265)#668 |
| 61. | Port Jervis | 0.34% | 0.20%(+0.147)#61 | 0.093%(+0.250)#699 |
| 62. | New York | 0.34% | 0.20%(+0.146)#62 | 0.093%(+0.249)#704 |
| 63. | Florida | 0.34% | 0.20%(+0.144)#63 | 0.093%(+0.247)#706 |
| 64. | North Great River | 0.33% | 0.20%(+0.130)#64 | 0.093%(+0.233)#727 |
| 65. | Dobbs Ferry | 0.31% | 0.20%(+0.118)#65 | 0.093%(+0.222)#744 |
| 66. | Vassar College | 0.30% | 0.20%(+0.102)#66 | 0.093%(+0.205)#774 |
| 67. | Farmingdale | 0.30% | 0.20%(+0.100)#67 | 0.093%(+0.203)#780 |
| 68. | Roslyn Estates | 0.30% | 0.20%(+0.100)#68 | 0.093%(+0.203)#781 |
| 69. | Valley Stream | 0.30% | 0.20%(+0.099)#69 | 0.093%(+0.202)#782 |
| 70. | West Hempstead | 0.28% | 0.20%(+0.088)#70 | 0.093%(+0.191)#802 |
| 71. | Myers Corner | 0.28% | 0.20%(+0.085)#71 | 0.093%(+0.188)#807 |
| 72. | Big Flats | 0.27% | 0.20%(+0.077)#72 | 0.093%(+0.180)#821 |
| 73. | Massapequa Park | 0.27% | 0.20%(+0.073)#73 | 0.093%(+0.176)#834 |
| 74. | Southampton | 0.27% | 0.20%(+0.071)#74 | 0.093%(+0.174)#841 |
| 75. | Garden City South | 0.27% | 0.20%(+0.071)#75 | 0.093%(+0.174)#843 |
| 76. | Watervliet | 0.26% | 0.20%(+0.065)#76 | 0.093%(+0.168)#857 |
| 77. | Commack | 0.26% | 0.20%(+0.063)#77 | 0.093%(+0.167)#865 |
| 78. | University At Buffalo | 0.26% | 0.20%(+0.062)#78 | 0.093%(+0.165)#870 |
| 79. | North Amityville | 0.25% | 0.20%(+0.054)#79 | 0.093%(+0.157)#888 |
| 80. | West Point | 0.25% | 0.20%(+0.054)#80 | 0.093%(+0.157)#889 |
| 81. | North Bellmore | 0.25% | 0.20%(+0.050)#81 | 0.093%(+0.153)#895 |
| 82. | East Islip | 0.24% | 0.20%(+0.047)#82 | 0.093%(+0.150)#908 |
| 83. | Patchogue | 0.24% | 0.20%(+0.046)#83 | 0.093%(+0.150)#910 |
| 84. | Hillcrest | 0.23% | 0.20%(+0.036)#84 | 0.093%(+0.139)#937 |
| 85. | East Northport | 0.23% | 0.20%(+0.035)#85 | 0.093%(+0.138)#938 |
| 86. | South Farmingdale | 0.22% | 0.20%(+0.023)#86 | 0.093%(+0.126)#969 |
| 87. | Thomaston | 0.22% | 0.20%(+0.022)#87 | 0.093%(+0.125)#973 |
| 88. | Islip | 0.21% | 0.20%(+0.012)#88 | 0.093%(+0.115)#1,002 |
| 89. | Latham | 0.20% | 0.20%(+0.008)#89 | 0.093%(+0.112)#1,012 |
| 90. | Clarkson | 0.20% | 0.20%(+0.003)#90 | 0.093%(+0.106)#1,031 |
| 91. | Kiryas Joel | 0.20% | 0.20%(+0.001)#91 | 0.093%(+0.104)#1,038 |
| 92. | Franklin Square | 0.20% | 0.20%(+0.000)#92 | 0.093%(+0.104)#1,042 |
| 93. | Cooperstown | 0.20% | 0.20%(+0.000)#93 | 0.093%(+0.103)#1,043 |
| 94. | Sackets Harbor | 0.20% | 0.20%(-0.001)#94 | 0.093%(+0.103)#1,046 |
| 95. | Mineola | 0.20% | 0.20%(-0.001)#95 | 0.093%(+0.102)#1,047 |
| 96. | Lindenhurst | 0.20% | 0.20%(-0.001)#96 | 0.093%(+0.102)#1,049 |
| 97. | West Hills | 0.19% | 0.20%(-0.002)#97 | 0.093%(+0.101)#1,052 |
| 98. | Russell Gardens | 0.18% | 0.20%(-0.015)#98 | 0.093%(+0.088)#1,093 |
| 99. | Inwood | 0.18% | 0.20%(-0.017)#99 | 0.093%(+0.086)#1,100 |
| 100. | North New Hyde Park | 0.16% | 0.20%(-0.040)#100 | 0.093%(+0.064)#1,175 |
Common Questions
What are the Top 10 Cities with the Highest Percentage of Egyptian Population in New York?
Top 10 Cities with the Highest Percentage of Egyptian Population in New York are:
#1
3.98%
#2
3.38%
#3
3.11%
#4
2.51%
#5
2.30%
#6
1.96%
#7
1.87%
#8
1.59%
#9
1.47%
#10
1.46%
What city has the Highest Percentage of Egyptian Population in New York?
North Ballston Spa has the Highest Percentage of Egyptian Population in New York with 3.98%.
What is the Percentage of Egyptian Population in the State of New York?
Percentage of Egyptian Population in New York is 0.20%.
What is the Percentage of Egyptian Population in the United States?
Percentage of Egyptian Population in the United States is 0.093%.