Cities with the Highest Percentage of Egyptian Population in Ohio
RELATED REPORTS & OPTIONS
Egyptian
Ohio
Compare Cities
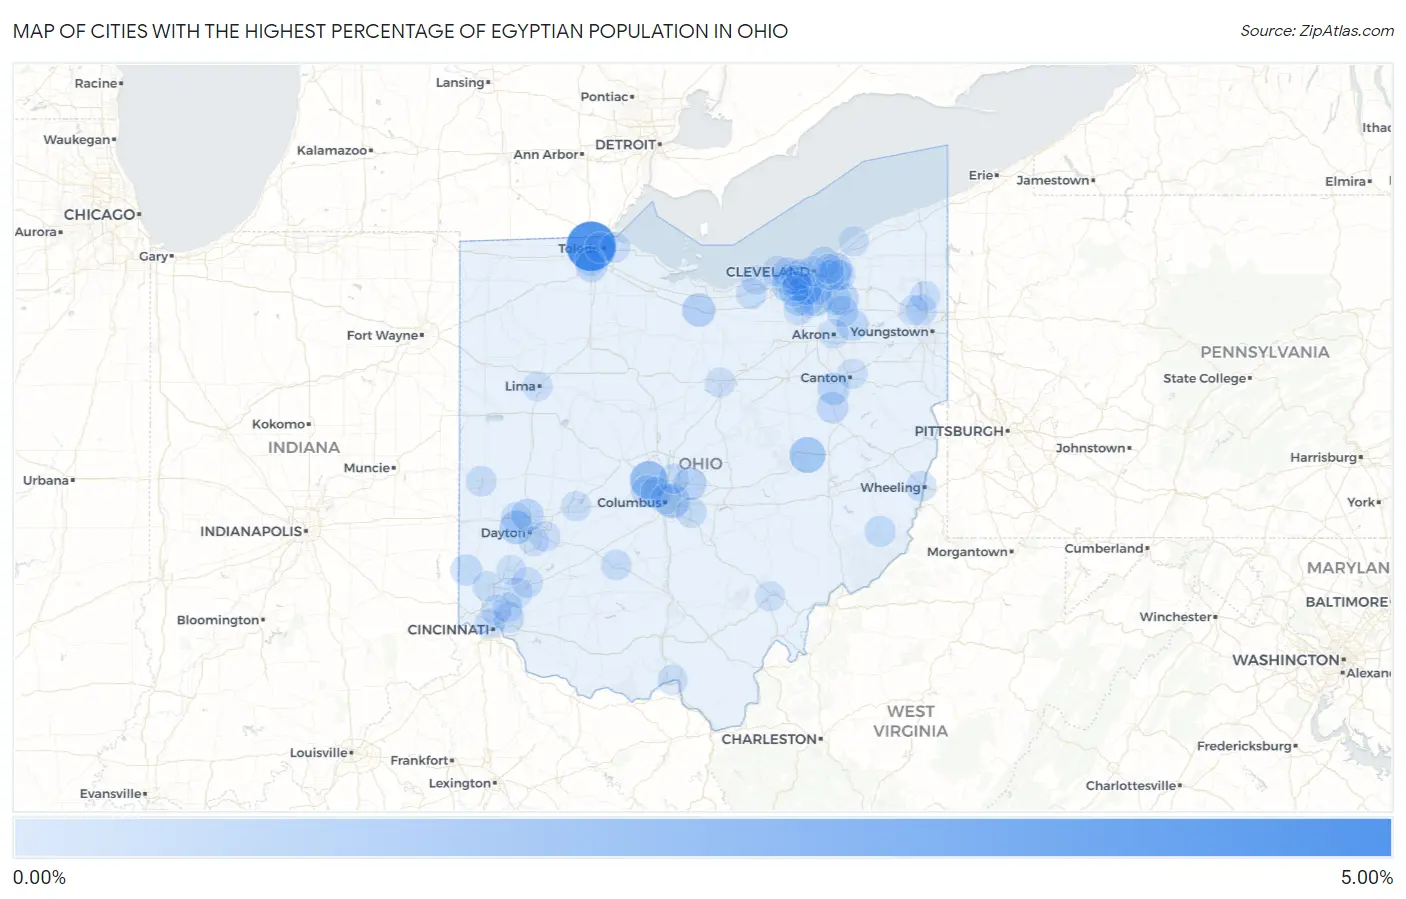
Map of Cities with the Highest Percentage of Egyptian Population in Ohio
0.00%
5.00%
Cities with the Highest Percentage of Egyptian Population in Ohio
| City | Egyptian | vs State | vs National | |
| 1. | Ottawa Hills | 4.79% | 0.067%(+4.72)#1 | 0.093%(+4.70)#17 |
| 2. | Dublin | 1.84% | 0.067%(+1.78)#2 | 0.093%(+1.75)#101 |
| 3. | West Lafayette | 1.37% | 0.067%(+1.31)#3 | 0.093%(+1.28)#150 |
| 4. | Bexley | 0.95% | 0.067%(+0.885)#4 | 0.093%(+0.860)#242 |
| 5. | Trotwood | 0.85% | 0.067%(+0.780)#5 | 0.093%(+0.754)#283 |
| 6. | Monroeville | 0.79% | 0.067%(+0.725)#6 | 0.093%(+0.699)#300 |
| 7. | New Albany | 0.68% | 0.067%(+0.608)#7 | 0.093%(+0.582)#355 |
| 8. | North Olmsted | 0.65% | 0.067%(+0.587)#8 | 0.093%(+0.561)#372 |
| 9. | Beachwood | 0.62% | 0.067%(+0.554)#9 | 0.093%(+0.528)#395 |
| 10. | Twinsburg | 0.58% | 0.067%(+0.508)#10 | 0.093%(+0.482)#431 |
| 11. | Vandalia | 0.57% | 0.067%(+0.501)#11 | 0.093%(+0.475)#438 |
| 12. | Broadview Heights | 0.57% | 0.067%(+0.498)#12 | 0.093%(+0.472)#441 |
| 13. | North Royalton | 0.55% | 0.067%(+0.482)#13 | 0.093%(+0.456)#456 |
| 14. | Parma | 0.52% | 0.067%(+0.455)#14 | 0.093%(+0.429)#476 |
| 15. | Lyndhurst | 0.52% | 0.067%(+0.449)#15 | 0.093%(+0.423)#481 |
| 16. | Seven Hills | 0.49% | 0.067%(+0.421)#16 | 0.093%(+0.395)#505 |
| 17. | Navarre | 0.48% | 0.067%(+0.414)#17 | 0.093%(+0.388)#509 |
| 18. | Hilliard | 0.46% | 0.067%(+0.392)#18 | 0.093%(+0.366)#527 |
| 19. | Parma Heights | 0.45% | 0.067%(+0.387)#19 | 0.093%(+0.361)#535 |
| 20. | Bratenahl | 0.42% | 0.067%(+0.354)#20 | 0.093%(+0.329)#577 |
| 21. | Perrysburg | 0.40% | 0.067%(+0.331)#21 | 0.093%(+0.305)#604 |
| 22. | Upper Arlington | 0.39% | 0.067%(+0.327)#22 | 0.093%(+0.301)#608 |
| 23. | Strasburg | 0.39% | 0.067%(+0.320)#23 | 0.093%(+0.294)#626 |
| 24. | Kent | 0.38% | 0.067%(+0.317)#24 | 0.093%(+0.291)#631 |
| 25. | Hudson | 0.32% | 0.067%(+0.250)#25 | 0.093%(+0.224)#742 |
| 26. | Strongsville | 0.30% | 0.067%(+0.229)#26 | 0.093%(+0.203)#779 |
| 27. | Oxford | 0.29% | 0.067%(+0.227)#27 | 0.093%(+0.201)#784 |
| 28. | Woodsfield | 0.26% | 0.067%(+0.191)#28 | 0.093%(+0.165)#871 |
| 29. | Columbus | 0.20% | 0.067%(+0.130)#29 | 0.093%(+0.104)#1,041 |
| 30. | Madeira | 0.19% | 0.067%(+0.123)#30 | 0.093%(+0.098)#1,067 |
| 31. | Pickerington | 0.18% | 0.067%(+0.109)#31 | 0.093%(+0.083)#1,111 |
| 32. | Howland Center | 0.18% | 0.067%(+0.108)#32 | 0.093%(+0.082)#1,117 |
| 33. | South Amherst | 0.17% | 0.067%(+0.098)#33 | 0.093%(+0.072)#1,146 |
| 34. | Washington Court House | 0.15% | 0.067%(+0.085)#34 | 0.093%(+0.059)#1,190 |
| 35. | Westlake | 0.15% | 0.067%(+0.085)#35 | 0.093%(+0.059)#1,191 |
| 36. | Toledo | 0.15% | 0.067%(+0.078)#36 | 0.093%(+0.052)#1,223 |
| 37. | Greenville | 0.14% | 0.067%(+0.074)#37 | 0.093%(+0.048)#1,246 |
| 38. | Macedonia | 0.14% | 0.067%(+0.073)#38 | 0.093%(+0.047)#1,252 |
| 39. | Rocky River | 0.14% | 0.067%(+0.072)#39 | 0.093%(+0.046)#1,255 |
| 40. | Bridgeport | 0.14% | 0.067%(+0.071)#40 | 0.093%(+0.045)#1,261 |
| 41. | Lebanon | 0.13% | 0.067%(+0.066)#41 | 0.093%(+0.040)#1,288 |
| 42. | Pepper Pike | 0.13% | 0.067%(+0.065)#42 | 0.093%(+0.039)#1,292 |
| 43. | Avon Lake | 0.13% | 0.067%(+0.059)#43 | 0.093%(+0.033)#1,321 |
| 44. | Bay Village | 0.12% | 0.067%(+0.057)#44 | 0.093%(+0.031)#1,329 |
| 45. | Englewood | 0.12% | 0.067%(+0.052)#45 | 0.093%(+0.026)#1,362 |
| 46. | Beavercreek | 0.11% | 0.067%(+0.044)#46 | 0.093%(+0.018)#1,406 |
| 47. | Brunswick | 0.11% | 0.067%(+0.040)#47 | 0.093%(+0.014)#1,428 |
| 48. | Oregon | 0.11% | 0.067%(+0.038)#48 | 0.093%(+0.012)#1,440 |
| 49. | Portsmouth | 0.094% | 0.067%(+0.026)#49 | 0.093%(+0.000)#1,514 |
| 50. | Mason | 0.083% | 0.067%(+0.016)#50 | 0.093%(-0.010)#1,574 |
| 51. | Lakewood | 0.083% | 0.067%(+0.016)#51 | 0.093%(-0.010)#1,577 |
| 52. | Wyoming | 0.080% | 0.067%(+0.013)#52 | 0.093%(-0.013)#1,593 |
| 53. | Westerville | 0.077% | 0.067%(+0.010)#53 | 0.093%(-0.016)#1,618 |
| 54. | Cortland | 0.071% | 0.067%(+0.003)#54 | 0.093%(-0.023)#1,668 |
| 55. | Cincinnati | 0.065% | 0.067%(-0.003)#55 | 0.093%(-0.029)#1,714 |
| 56. | Fairview Park | 0.064% | 0.067%(-0.003)#56 | 0.093%(-0.029)#1,719 |
| 57. | Blue Ash | 0.060% | 0.067%(-0.007)#57 | 0.093%(-0.033)#1,750 |
| 58. | Springfield | 0.051% | 0.067%(-0.016)#58 | 0.093%(-0.042)#1,818 |
| 59. | Cleveland | 0.051% | 0.067%(-0.016)#59 | 0.093%(-0.042)#1,820 |
| 60. | Berea | 0.049% | 0.067%(-0.019)#60 | 0.093%(-0.045)#1,845 |
| 61. | Hamilton | 0.048% | 0.067%(-0.020)#61 | 0.093%(-0.046)#1,850 |
| 62. | Maumee | 0.043% | 0.067%(-0.024)#62 | 0.093%(-0.050)#1,891 |
| 63. | Canton | 0.041% | 0.067%(-0.026)#63 | 0.093%(-0.052)#1,909 |
| 64. | Mentor | 0.038% | 0.067%(-0.029)#64 | 0.093%(-0.055)#1,945 |
| 65. | Brook Park | 0.032% | 0.067%(-0.035)#65 | 0.093%(-0.061)#2,008 |
| 66. | Kettering | 0.031% | 0.067%(-0.036)#66 | 0.093%(-0.062)#2,022 |
| 67. | Shaker Heights | 0.031% | 0.067%(-0.037)#67 | 0.093%(-0.063)#2,023 |
| 68. | Athens | 0.031% | 0.067%(-0.037)#68 | 0.093%(-0.063)#2,024 |
| 69. | Cleveland Heights | 0.024% | 0.067%(-0.043)#69 | 0.093%(-0.069)#2,093 |
| 70. | Middletown | 0.020% | 0.067%(-0.048)#70 | 0.093%(-0.074)#2,141 |
| 71. | Lima | 0.020% | 0.067%(-0.048)#71 | 0.093%(-0.074)#2,142 |
| 72. | Warren | 0.015% | 0.067%(-0.052)#72 | 0.093%(-0.078)#2,188 |
| 73. | Akron | 0.014% | 0.067%(-0.053)#73 | 0.093%(-0.079)#2,211 |
| 74. | Mansfield | 0.010% | 0.067%(-0.057)#74 | 0.093%(-0.083)#2,244 |
| 75. | Lorain | 0.0031% | 0.067%(-0.064)#75 | 0.093%(-0.090)#2,296 |
Common Questions
What are the Top 10 Cities with the Highest Percentage of Egyptian Population in Ohio?
Top 10 Cities with the Highest Percentage of Egyptian Population in Ohio are:
#1
4.79%
#2
1.84%
#3
1.37%
#4
0.95%
#5
0.85%
#6
0.79%
#7
0.68%
#8
0.65%
#9
0.62%
#10
0.58%
What city has the Highest Percentage of Egyptian Population in Ohio?
Ottawa Hills has the Highest Percentage of Egyptian Population in Ohio with 4.79%.
What is the Percentage of Egyptian Population in the State of Ohio?
Percentage of Egyptian Population in Ohio is 0.067%.
What is the Percentage of Egyptian Population in the United States?
Percentage of Egyptian Population in the United States is 0.093%.