Cities with the Highest Percentage of Egyptian Population in Illinois
RELATED REPORTS & OPTIONS
Egyptian
Illinois
Compare Cities
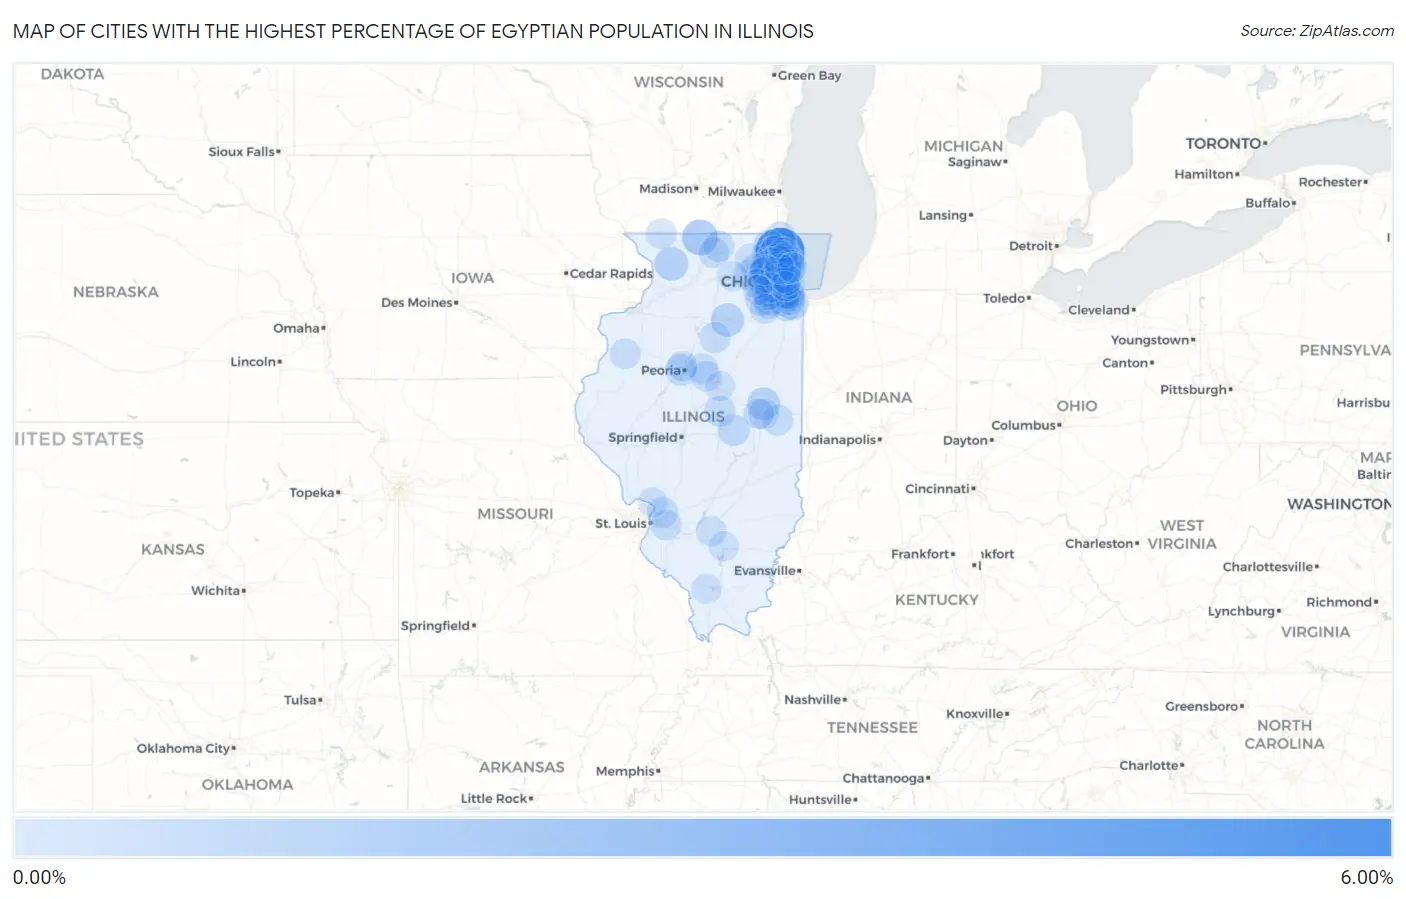
Map of Cities with the Highest Percentage of Egyptian Population in Illinois
0.00%
6.00%
Cities with the Highest Percentage of Egyptian Population in Illinois
| City | Egyptian | vs State | vs National | |
| 1. | Mettawa | 5.49% | 0.067%(+5.42)#1 | 0.093%(+5.40)#16 |
| 2. | Durand | 1.50% | 0.067%(+1.43)#2 | 0.093%(+1.41)#133 |
| 3. | Burr Ridge | 1.07% | 0.067%(+1.00)#3 | 0.093%(+0.976)#202 |
| 4. | Bridgeview | 1.05% | 0.067%(+0.984)#4 | 0.093%(+0.957)#208 |
| 5. | Darien | 0.99% | 0.067%(+0.926)#5 | 0.093%(+0.900)#225 |
| 6. | Lanark | 0.97% | 0.067%(+0.899)#6 | 0.093%(+0.872)#236 |
| 7. | Prospect Heights | 0.90% | 0.067%(+0.828)#7 | 0.093%(+0.802)#266 |
| 8. | Ottawa | 0.88% | 0.067%(+0.810)#8 | 0.093%(+0.783)#273 |
| 9. | Romeoville | 0.82% | 0.067%(+0.758)#9 | 0.093%(+0.731)#287 |
| 10. | Hanover Park | 0.78% | 0.067%(+0.718)#10 | 0.093%(+0.691)#306 |
| 11. | Thomasboro | 0.78% | 0.067%(+0.715)#11 | 0.093%(+0.689)#307 |
| 12. | Niles | 0.70% | 0.067%(+0.628)#12 | 0.093%(+0.602)#342 |
| 13. | Deer Park | 0.68% | 0.067%(+0.610)#13 | 0.093%(+0.583)#352 |
| 14. | Wheaton | 0.67% | 0.067%(+0.604)#14 | 0.093%(+0.577)#357 |
| 15. | Hazel Crest | 0.65% | 0.067%(+0.581)#15 | 0.093%(+0.554)#378 |
| 16. | Hinsdale | 0.65% | 0.067%(+0.580)#16 | 0.093%(+0.553)#379 |
| 17. | Woodridge | 0.63% | 0.067%(+0.559)#17 | 0.093%(+0.533)#391 |
| 18. | Berkeley | 0.51% | 0.067%(+0.444)#18 | 0.093%(+0.418)#483 |
| 19. | Cerro Gordo | 0.50% | 0.067%(+0.429)#19 | 0.093%(+0.403)#495 |
| 20. | Tinley Park | 0.49% | 0.067%(+0.428)#20 | 0.093%(+0.401)#496 |
| 21. | Bannockburn | 0.47% | 0.067%(+0.403)#21 | 0.093%(+0.376)#517 |
| 22. | Palos Hills | 0.45% | 0.067%(+0.382)#22 | 0.093%(+0.355)#548 |
| 23. | West Peoria | 0.42% | 0.067%(+0.357)#23 | 0.093%(+0.330)#575 |
| 24. | Wadsworth | 0.41% | 0.067%(+0.339)#24 | 0.093%(+0.313)#597 |
| 25. | Plainfield | 0.40% | 0.067%(+0.334)#25 | 0.093%(+0.307)#602 |
| 26. | Westmont | 0.39% | 0.067%(+0.320)#26 | 0.093%(+0.294)#627 |
| 27. | Lombard | 0.35% | 0.067%(+0.287)#27 | 0.093%(+0.261)#677 |
| 28. | North Barrington | 0.35% | 0.067%(+0.286)#28 | 0.093%(+0.259)#681 |
| 29. | Clinton | 0.35% | 0.067%(+0.282)#29 | 0.093%(+0.255)#689 |
| 30. | Glencoe | 0.34% | 0.067%(+0.275)#30 | 0.093%(+0.248)#705 |
| 31. | Glen Carbon | 0.29% | 0.067%(+0.226)#31 | 0.093%(+0.200)#788 |
| 32. | Homer | 0.28% | 0.067%(+0.216)#32 | 0.093%(+0.190)#804 |
| 33. | Libertyville | 0.28% | 0.067%(+0.210)#33 | 0.093%(+0.184)#814 |
| 34. | Loves Park | 0.27% | 0.067%(+0.203)#34 | 0.093%(+0.177)#831 |
| 35. | Wayne | 0.27% | 0.067%(+0.203)#35 | 0.093%(+0.176)#835 |
| 36. | Lincolnshire | 0.27% | 0.067%(+0.199)#36 | 0.093%(+0.172)#846 |
| 37. | Hickory Hills | 0.25% | 0.067%(+0.188)#37 | 0.093%(+0.161)#882 |
| 38. | Lostant | 0.25% | 0.067%(+0.183)#38 | 0.093%(+0.156)#891 |
| 39. | Eureka | 0.24% | 0.067%(+0.169)#39 | 0.093%(+0.143)#926 |
| 40. | Round Lake | 0.24% | 0.067%(+0.169)#40 | 0.093%(+0.142)#927 |
| 41. | Oak Lawn | 0.22% | 0.067%(+0.157)#41 | 0.093%(+0.130)#958 |
| 42. | Lily Lake | 0.22% | 0.067%(+0.149)#42 | 0.093%(+0.122)#978 |
| 43. | Rockford | 0.21% | 0.067%(+0.146)#43 | 0.093%(+0.120)#982 |
| 44. | Inverness | 0.21% | 0.067%(+0.140)#44 | 0.093%(+0.114)#1,005 |
| 45. | Urbana | 0.18% | 0.067%(+0.114)#45 | 0.093%(+0.087)#1,095 |
| 46. | Champaign | 0.17% | 0.067%(+0.106)#46 | 0.093%(+0.079)#1,127 |
| 47. | O Fallon | 0.16% | 0.067%(+0.095)#47 | 0.093%(+0.069)#1,157 |
| 48. | Downers Grove | 0.16% | 0.067%(+0.091)#48 | 0.093%(+0.065)#1,170 |
| 49. | Arlington Heights | 0.16% | 0.067%(+0.091)#49 | 0.093%(+0.064)#1,173 |
| 50. | Naperville | 0.15% | 0.067%(+0.082)#50 | 0.093%(+0.055)#1,205 |
| 51. | Highland Park | 0.15% | 0.067%(+0.079)#51 | 0.093%(+0.052)#1,221 |
| 52. | Northbrook | 0.14% | 0.067%(+0.076)#52 | 0.093%(+0.050)#1,233 |
| 53. | Wheeling | 0.14% | 0.067%(+0.075)#53 | 0.093%(+0.048)#1,241 |
| 54. | Congerville | 0.14% | 0.067%(+0.074)#54 | 0.093%(+0.047)#1,248 |
| 55. | Westchester | 0.14% | 0.067%(+0.071)#55 | 0.093%(+0.044)#1,263 |
| 56. | Monmouth | 0.14% | 0.067%(+0.070)#56 | 0.093%(+0.043)#1,269 |
| 57. | Hoffman Estates | 0.14% | 0.067%(+0.068)#57 | 0.093%(+0.042)#1,274 |
| 58. | West Chicago | 0.13% | 0.067%(+0.066)#58 | 0.093%(+0.039)#1,293 |
| 59. | Warren | 0.13% | 0.067%(+0.062)#59 | 0.093%(+0.036)#1,313 |
| 60. | Mundelein | 0.12% | 0.067%(+0.050)#60 | 0.093%(+0.024)#1,372 |
| 61. | Park Ridge | 0.11% | 0.067%(+0.045)#61 | 0.093%(+0.018)#1,405 |
| 62. | Carol Stream | 0.11% | 0.067%(+0.044)#62 | 0.093%(+0.018)#1,409 |
| 63. | Alsip | 0.10% | 0.067%(+0.034)#63 | 0.093%(+0.007)#1,469 |
| 64. | Crest Hill | 0.10% | 0.067%(+0.034)#64 | 0.093%(+0.007)#1,474 |
| 65. | Peoria | 0.089% | 0.067%(+0.022)#65 | 0.093%(-0.004)#1,538 |
| 66. | Orland Park | 0.086% | 0.067%(+0.019)#66 | 0.093%(-0.008)#1,556 |
| 67. | Forest Park | 0.085% | 0.067%(+0.018)#67 | 0.093%(-0.009)#1,563 |
| 68. | Bolingbrook | 0.084% | 0.067%(+0.017)#68 | 0.093%(-0.009)#1,568 |
| 69. | Centralia | 0.083% | 0.067%(+0.016)#69 | 0.093%(-0.011)#1,580 |
| 70. | Elgin | 0.080% | 0.067%(+0.013)#70 | 0.093%(-0.014)#1,601 |
| 71. | Addison | 0.073% | 0.067%(+0.006)#71 | 0.093%(-0.021)#1,652 |
| 72. | Buffalo Grove | 0.068% | 0.067%(+0.001)#72 | 0.093%(-0.026)#1,695 |
| 73. | Palatine | 0.064% | 0.067%(-0.003)#73 | 0.093%(-0.029)#1,721 |
| 74. | Chicago | 0.063% | 0.067%(-0.004)#74 | 0.093%(-0.031)#1,730 |
| 75. | Deerfield | 0.063% | 0.067%(-0.004)#75 | 0.093%(-0.031)#1,731 |
| 76. | Morton Grove | 0.056% | 0.067%(-0.011)#76 | 0.093%(-0.037)#1,774 |
| 77. | Huntley | 0.054% | 0.067%(-0.013)#77 | 0.093%(-0.039)#1,788 |
| 78. | Wilmette | 0.054% | 0.067%(-0.013)#78 | 0.093%(-0.039)#1,791 |
| 79. | Bartlett | 0.054% | 0.067%(-0.013)#79 | 0.093%(-0.040)#1,793 |
| 80. | Elmhurst | 0.050% | 0.067%(-0.016)#80 | 0.093%(-0.043)#1,830 |
| 81. | Midlothian | 0.042% | 0.067%(-0.025)#81 | 0.093%(-0.051)#1,901 |
| 82. | Elmwood Park | 0.041% | 0.067%(-0.026)#82 | 0.093%(-0.052)#1,907 |
| 83. | Mount Prospect | 0.037% | 0.067%(-0.029)#83 | 0.093%(-0.056)#1,951 |
| 84. | Bloomington | 0.036% | 0.067%(-0.031)#84 | 0.093%(-0.058)#1,969 |
| 85. | Batavia | 0.034% | 0.067%(-0.033)#85 | 0.093%(-0.059)#1,986 |
| 86. | Oak Park | 0.033% | 0.067%(-0.033)#86 | 0.093%(-0.060)#1,999 |
| 87. | Skokie | 0.031% | 0.067%(-0.036)#87 | 0.093%(-0.062)#2,019 |
| 88. | Alton | 0.031% | 0.067%(-0.036)#88 | 0.093%(-0.062)#2,021 |
| 89. | Mount Vernon | 0.027% | 0.067%(-0.040)#89 | 0.093%(-0.066)#2,056 |
| 90. | Lake Forest | 0.026% | 0.067%(-0.041)#90 | 0.093%(-0.068)#2,074 |
| 91. | Lisle | 0.026% | 0.067%(-0.041)#91 | 0.093%(-0.068)#2,077 |
| 92. | Waukegan | 0.025% | 0.067%(-0.042)#92 | 0.093%(-0.069)#2,090 |
| 93. | Streamwood | 0.023% | 0.067%(-0.044)#93 | 0.093%(-0.071)#2,108 |
| 94. | Lyons | 0.019% | 0.067%(-0.048)#94 | 0.093%(-0.075)#2,152 |
| 95. | Carbondale | 0.018% | 0.067%(-0.049)#95 | 0.093%(-0.075)#2,160 |
| 96. | Aurora | 0.015% | 0.067%(-0.051)#96 | 0.093%(-0.078)#2,183 |
| 97. | Joliet | 0.015% | 0.067%(-0.052)#97 | 0.093%(-0.078)#2,187 |
| 98. | Des Plaines | 0.015% | 0.067%(-0.052)#98 | 0.093%(-0.078)#2,190 |
| 99. | Dekalb | 0.015% | 0.067%(-0.052)#99 | 0.093%(-0.079)#2,195 |
| 100. | Evanston | 0.014% | 0.067%(-0.053)#100 | 0.093%(-0.079)#2,210 |
Common Questions
What are the Top 10 Cities with the Highest Percentage of Egyptian Population in Illinois?
Top 10 Cities with the Highest Percentage of Egyptian Population in Illinois are:
#1
5.49%
#2
1.50%
#3
1.07%
#4
1.05%
#5
0.99%
#6
0.97%
#7
0.90%
#8
0.88%
#9
0.82%
#10
0.78%
What city has the Highest Percentage of Egyptian Population in Illinois?
Mettawa has the Highest Percentage of Egyptian Population in Illinois with 5.49%.
What is the Percentage of Egyptian Population in the State of Illinois?
Percentage of Egyptian Population in Illinois is 0.067%.
What is the Percentage of Egyptian Population in the United States?
Percentage of Egyptian Population in the United States is 0.093%.