Cities with the Highest Poverty Level Among Single Fathers in Massachusetts
RELATED REPORTS & OPTIONS
Highest Poverty | Single Father
Massachusetts
Compare Cities
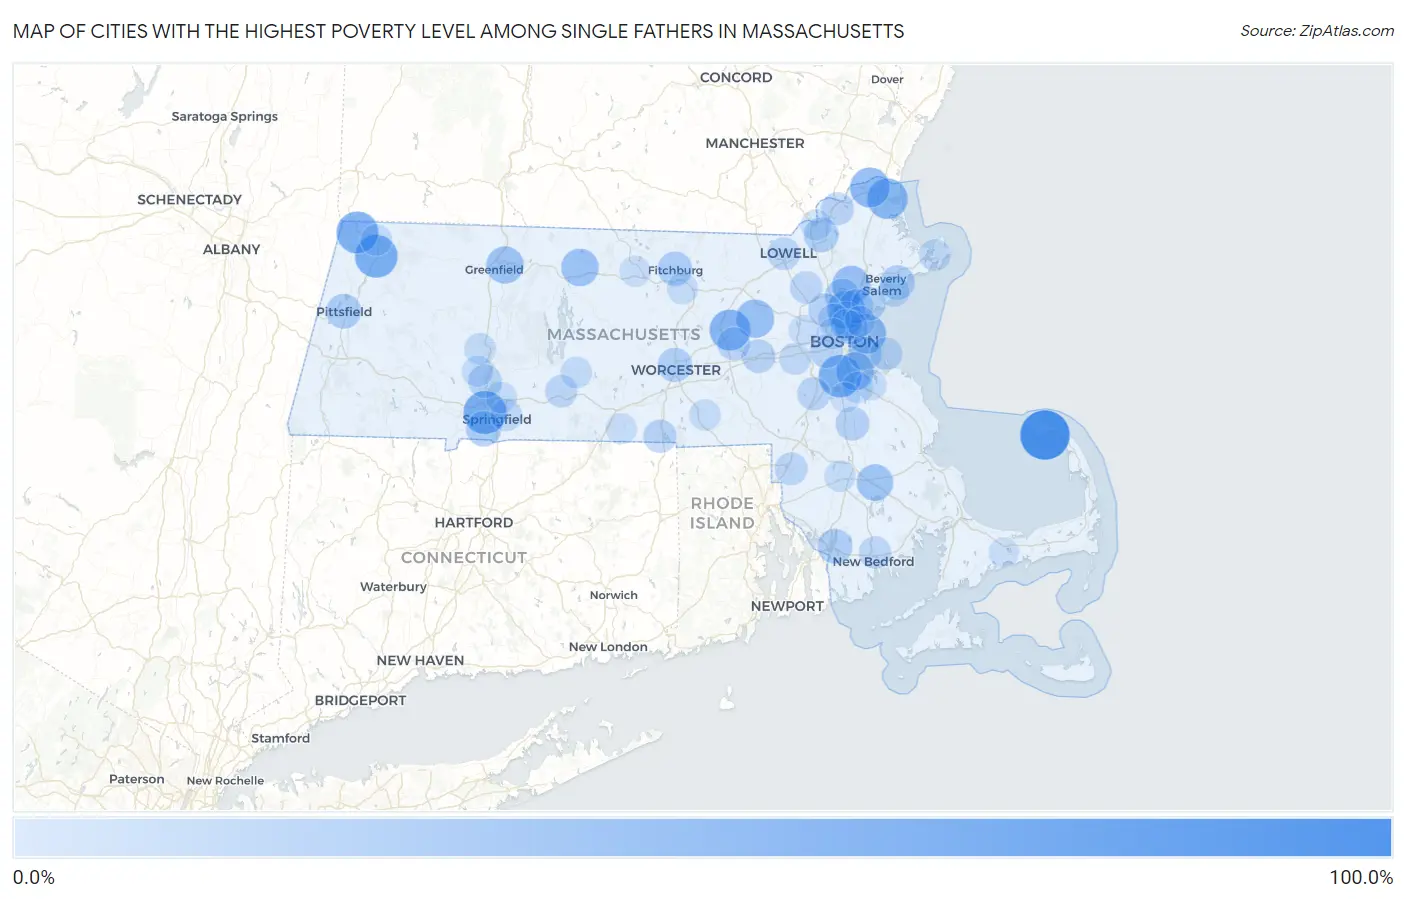
Map of Cities with the Highest Poverty Level Among Single Fathers in Massachusetts
0.0%
100.0%
Cities with the Highest Poverty Level Among Single Fathers in Massachusetts
| City | Single Father Poverty | vs State | vs National | |
| 1. | Provincetown | 100.0% | 12.5%(+87.5)#1 | 13.7%(+86.3)#140 |
| 2. | West Springfield Town | 65.5% | 12.5%(+53.0)#2 | 13.7%(+51.8)#1,768 |
| 3. | Adams | 64.0% | 12.5%(+51.5)#3 | 13.7%(+50.3)#1,803 |
| 4. | Milton | 62.5% | 12.5%(+50.0)#4 | 13.7%(+48.8)#1,834 |
| 5. | Williamstown | 60.0% | 12.5%(+47.5)#5 | 13.7%(+46.3)#1,918 |
| 6. | Hudson | 54.6% | 12.5%(+42.2)#6 | 13.7%(+40.9)#2,155 |
| 7. | Newburyport | 51.8% | 12.5%(+39.3)#7 | 13.7%(+38.1)#2,289 |
| 8. | Amesbury Town | 48.8% | 12.5%(+36.4)#8 | 13.7%(+35.1)#2,538 |
| 9. | Winthrop Town | 47.9% | 12.5%(+35.4)#9 | 13.7%(+34.2)#2,564 |
| 10. | Maynard | 41.3% | 12.5%(+28.8)#10 | 13.7%(+27.6)#2,897 |
| 11. | Lynnfield | 40.7% | 12.5%(+28.3)#11 | 13.7%(+27.0)#2,921 |
| 12. | Melrose | 40.1% | 12.5%(+27.7)#12 | 13.7%(+26.4)#2,944 |
| 13. | Quincy | 39.7% | 12.5%(+27.2)#13 | 13.7%(+26.0)#3,023 |
| 14. | Athol | 37.3% | 12.5%(+24.8)#14 | 13.7%(+23.6)#3,165 |
| 15. | Turners Falls | 36.0% | 12.5%(+23.5)#15 | 13.7%(+22.3)#3,258 |
| 16. | Middleborough Center | 32.3% | 12.5%(+19.8)#16 | 13.7%(+18.6)#3,607 |
| 17. | Agawam Town | 25.9% | 12.5%(+13.4)#17 | 13.7%(+12.1)#4,171 |
| 18. | Wakefield | 24.3% | 12.5%(+11.8)#18 | 13.7%(+10.6)#4,336 |
| 19. | Pittsfield | 24.0% | 12.5%(+11.5)#19 | 13.7%(+10.2)#4,366 |
| 20. | Fall River | 23.3% | 12.5%(+10.8)#20 | 13.7%(+9.60)#4,423 |
| 21. | Lawrence | 23.2% | 12.5%(+10.7)#21 | 13.7%(+9.49)#4,432 |
| 22. | Fitchburg | 22.7% | 12.5%(+10.2)#22 | 13.7%(+8.98)#4,498 |
| 23. | Beverly | 22.0% | 12.5%(+9.54)#23 | 13.7%(+8.31)#4,574 |
| 24. | Worcester | 20.8% | 12.5%(+8.32)#24 | 13.7%(+7.10)#4,719 |
| 25. | Malden | 20.7% | 12.5%(+8.21)#25 | 13.7%(+6.98)#4,735 |
| 26. | Saugus | 19.9% | 12.5%(+7.44)#26 | 13.7%(+6.21)#4,870 |
| 27. | Lynn | 18.5% | 12.5%(+6.05)#27 | 13.7%(+4.82)#5,040 |
| 28. | Boston | 18.3% | 12.5%(+5.80)#28 | 13.7%(+4.57)#5,067 |
| 29. | Holyoke | 17.9% | 12.5%(+5.46)#29 | 13.7%(+4.23)#5,128 |
| 30. | Chelsea | 17.8% | 12.5%(+5.37)#30 | 13.7%(+4.14)#5,135 |
| 31. | Brockton | 17.4% | 12.5%(+4.96)#31 | 13.7%(+3.73)#5,185 |
| 32. | Brookline | 16.7% | 12.5%(+4.18)#32 | 13.7%(+2.95)#5,263 |
| 33. | Framingham | 16.4% | 12.5%(+3.92)#33 | 13.7%(+2.69)#5,357 |
| 34. | Winchester | 16.3% | 12.5%(+3.81)#34 | 13.7%(+2.58)#5,368 |
| 35. | Webster | 15.5% | 12.5%(+3.02)#35 | 13.7%(+1.80)#5,474 |
| 36. | Norwood | 15.1% | 12.5%(+2.65)#36 | 13.7%(+1.42)#5,526 |
| 37. | Marlborough | 14.7% | 12.5%(+2.26)#37 | 13.7%(+1.04)#5,569 |
| 38. | Haverhill | 14.6% | 12.5%(+2.08)#38 | 13.7%(+0.851)#5,593 |
| 39. | Greenfield | 14.5% | 12.5%(+2.04)#39 | 13.7%(+0.810)#5,602 |
| 40. | Attleboro | 13.2% | 12.5%(+0.681)#40 | 13.7%(-0.548)#5,834 |
| 41. | Lowell | 12.8% | 12.5%(+0.353)#41 | 13.7%(-0.876)#5,876 |
| 42. | Medford | 12.2% | 12.5%(-0.272)#42 | 13.7%(-1.50)#5,986 |
| 43. | Pinehurst | 12.2% | 12.5%(-0.321)#43 | 13.7%(-1.55)#5,996 |
| 44. | Hull | 11.5% | 12.5%(-1.01)#44 | 13.7%(-2.24)#6,093 |
| 45. | Palmer Town | 11.4% | 12.5%(-1.07)#45 | 13.7%(-2.30)#6,102 |
| 46. | New Bedford | 10.9% | 12.5%(-1.55)#46 | 13.7%(-2.78)#6,183 |
| 47. | Wellesley | 9.9% | 12.5%(-2.55)#47 | 13.7%(-3.77)#6,353 |
| 48. | Springfield | 9.5% | 12.5%(-2.96)#48 | 13.7%(-4.19)#6,408 |
| 49. | Gloucester | 8.7% | 12.5%(-3.75)#49 | 13.7%(-4.98)#6,536 |
| 50. | Everett | 8.1% | 12.5%(-4.36)#50 | 13.7%(-5.59)#6,632 |
| 51. | Northampton | 8.0% | 12.5%(-4.44)#51 | 13.7%(-5.67)#6,645 |
| 52. | Ware | 7.9% | 12.5%(-4.61)#52 | 13.7%(-5.84)#6,670 |
| 53. | North Adams | 7.3% | 12.5%(-5.17)#53 | 13.7%(-6.40)#6,782 |
| 54. | Salem | 7.1% | 12.5%(-5.39)#54 | 13.7%(-6.62)#6,829 |
| 55. | Whitinsville | 6.8% | 12.5%(-5.67)#55 | 13.7%(-6.89)#6,865 |
| 56. | Taunton | 6.6% | 12.5%(-5.90)#56 | 13.7%(-7.13)#6,903 |
| 57. | Chicopee | 6.5% | 12.5%(-6.02)#57 | 13.7%(-7.25)#6,916 |
| 58. | Braintree Town | 6.2% | 12.5%(-6.29)#58 | 13.7%(-7.52)#6,959 |
| 59. | Leominster | 6.1% | 12.5%(-6.39)#59 | 13.7%(-7.62)#6,972 |
| 60. | Methuen Town | 5.6% | 12.5%(-6.91)#60 | 13.7%(-8.13)#7,034 |
| 61. | Easthampton Town | 5.6% | 12.5%(-6.91)#61 | 13.7%(-8.14)#7,035 |
| 62. | Gardner | 5.3% | 12.5%(-7.17)#62 | 13.7%(-8.40)#7,082 |
| 63. | Southbridge Town | 4.7% | 12.5%(-7.83)#63 | 13.7%(-9.06)#7,163 |
| 64. | Cambridge | 4.6% | 12.5%(-7.89)#64 | 13.7%(-9.12)#7,173 |
| 65. | Weymouth Town | 4.1% | 12.5%(-8.34)#65 | 13.7%(-9.57)#7,234 |
| 66. | Revere | 2.9% | 12.5%(-9.54)#66 | 13.7%(-10.8)#7,374 |
| 67. | Waltham | 2.8% | 12.5%(-9.67)#67 | 13.7%(-10.9)#7,393 |
| 68. | Barnstable Town | 1.7% | 12.5%(-10.8)#68 | 13.7%(-12.0)#7,503 |
| 69. | Randolph Town | 1.3% | 12.5%(-11.2)#69 | 13.7%(-12.4)#7,523 |
Common Questions
What are the Top 10 Cities with the Highest Poverty Level Among Single Fathers in Massachusetts?
Top 10 Cities with the Highest Poverty Level Among Single Fathers in Massachusetts are:
#1
100.0%
#2
65.5%
#3
64.0%
#4
62.5%
#5
60.0%
#6
54.6%
#7
51.8%
#8
48.8%
#9
47.9%
#10
41.3%
What city has the Highest Poverty Level Among Single Fathers in Massachusetts?
Provincetown has the Highest Poverty Level Among Single Fathers in Massachusetts with 100.0%.
What is the Poverty Level Among Single Fathers in the State of Massachusetts?
Poverty Level Among Single Fathers in Massachusetts is 12.5%.
What is the Poverty Level Among Single Fathers in the United States?
Poverty Level Among Single Fathers in the United States is 13.7%.