Cities with the Highest Poverty Level Among Single Fathers in Illinois
RELATED REPORTS & OPTIONS
Highest Poverty | Single Father
Illinois
Compare Cities
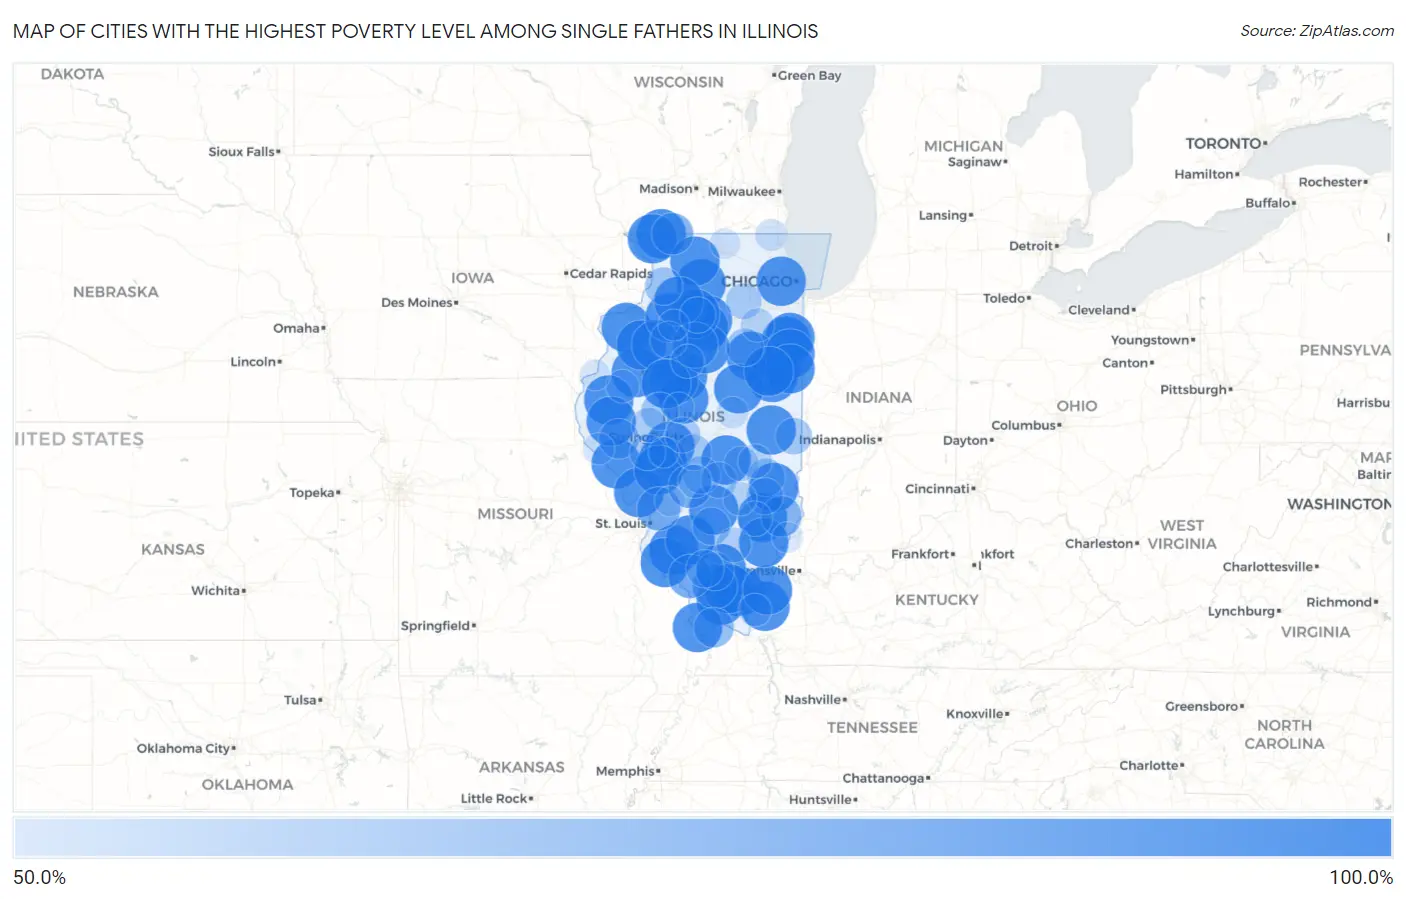
Map of Cities with the Highest Poverty Level Among Single Fathers in Illinois
0.0%
100.0%
Cities with the Highest Poverty Level Among Single Fathers in Illinois
| City | Single Father Poverty | vs State | vs National | |
| 1. | Hillside | 100.0% | 13.4%(+86.6)#1 | 13.7%(+86.3)#25 |
| 2. | Carrier Mills | 100.0% | 13.4%(+86.6)#2 | 13.7%(+86.3)#299 |
| 3. | North Pekin | 100.0% | 13.4%(+86.6)#3 | 13.7%(+86.3)#325 |
| 4. | Warren | 100.0% | 13.4%(+86.6)#4 | 13.7%(+86.3)#338 |
| 5. | Onarga | 100.0% | 13.4%(+86.6)#5 | 13.7%(+86.3)#395 |
| 6. | Marissa | 100.0% | 13.4%(+86.6)#6 | 13.7%(+86.3)#422 |
| 7. | Goreville | 100.0% | 13.4%(+86.6)#7 | 13.7%(+86.3)#432 |
| 8. | Franklin Grove | 100.0% | 13.4%(+86.6)#8 | 13.7%(+86.3)#445 |
| 9. | Loami | 100.0% | 13.4%(+86.6)#9 | 13.7%(+86.3)#468 |
| 10. | Evansville | 100.0% | 13.4%(+86.6)#10 | 13.7%(+86.3)#537 |
| 11. | Matherville | 100.0% | 13.4%(+86.6)#11 | 13.7%(+86.3)#558 |
| 12. | Apple Canyon Lake | 100.0% | 13.4%(+86.6)#12 | 13.7%(+86.3)#611 |
| 13. | Dalzell | 100.0% | 13.4%(+86.6)#13 | 13.7%(+86.3)#626 |
| 14. | Aroma Park | 100.0% | 13.4%(+86.6)#14 | 13.7%(+86.3)#628 |
| 15. | Noble | 100.0% | 13.4%(+86.6)#15 | 13.7%(+86.3)#639 |
| 16. | West City | 100.0% | 13.4%(+86.6)#16 | 13.7%(+86.3)#643 |
| 17. | Avon | 100.0% | 13.4%(+86.6)#17 | 13.7%(+86.3)#651 |
| 18. | San Jose | 100.0% | 13.4%(+86.6)#18 | 13.7%(+86.3)#660 |
| 19. | Sun River Terrace | 100.0% | 13.4%(+86.6)#19 | 13.7%(+86.3)#662 |
| 20. | Olive Branch | 100.0% | 13.4%(+86.6)#20 | 13.7%(+86.3)#682 |
| 21. | Mark | 100.0% | 13.4%(+86.6)#21 | 13.7%(+86.3)#706 |
| 22. | Sunnyland | 100.0% | 13.4%(+86.6)#22 | 13.7%(+86.3)#716 |
| 23. | Plymouth | 100.0% | 13.4%(+86.6)#23 | 13.7%(+86.3)#735 |
| 24. | Buckley | 100.0% | 13.4%(+86.6)#24 | 13.7%(+86.3)#744 |
| 25. | Leaf River | 100.0% | 13.4%(+86.6)#25 | 13.7%(+86.3)#767 |
| 26. | Saunemin | 100.0% | 13.4%(+86.6)#26 | 13.7%(+86.3)#775 |
| 27. | Arrowsmith | 100.0% | 13.4%(+86.6)#27 | 13.7%(+86.3)#799 |
| 28. | Nebo | 100.0% | 13.4%(+86.6)#28 | 13.7%(+86.3)#833 |
| 29. | Martinton | 100.0% | 13.4%(+86.6)#29 | 13.7%(+86.3)#848 |
| 30. | Woodland | 100.0% | 13.4%(+86.6)#30 | 13.7%(+86.3)#876 |
| 31. | Addieville | 100.0% | 13.4%(+86.6)#31 | 13.7%(+86.3)#898 |
| 32. | Crab Orchard | 100.0% | 13.4%(+86.6)#32 | 13.7%(+86.3)#931 |
| 33. | Henderson | 100.0% | 13.4%(+86.6)#33 | 13.7%(+86.3)#942 |
| 34. | Victoria | 100.0% | 13.4%(+86.6)#34 | 13.7%(+86.3)#948 |
| 35. | Thawville | 100.0% | 13.4%(+86.6)#35 | 13.7%(+86.3)#999 |
| 36. | Cave In Rock | 100.0% | 13.4%(+86.6)#36 | 13.7%(+86.3)#1,011 |
| 37. | Kingston Mines | 100.0% | 13.4%(+86.6)#37 | 13.7%(+86.3)#1,019 |
| 38. | Modesto | 100.0% | 13.4%(+86.6)#38 | 13.7%(+86.3)#1,029 |
| 39. | Mineral | 100.0% | 13.4%(+86.6)#39 | 13.7%(+86.3)#1,050 |
| 40. | Mound Station | 100.0% | 13.4%(+86.6)#40 | 13.7%(+86.3)#1,061 |
| 41. | Otterville | 100.0% | 13.4%(+86.6)#41 | 13.7%(+86.3)#1,068 |
| 42. | Banner | 100.0% | 13.4%(+86.6)#42 | 13.7%(+86.3)#1,077 |
| 43. | Old Shawneetown | 100.0% | 13.4%(+86.6)#43 | 13.7%(+86.3)#1,091 |
| 44. | Hettick | 100.0% | 13.4%(+86.6)#44 | 13.7%(+86.3)#1,092 |
| 45. | La Rose | 100.0% | 13.4%(+86.6)#45 | 13.7%(+86.3)#1,114 |
| 46. | Dover | 100.0% | 13.4%(+86.6)#46 | 13.7%(+86.3)#1,117 |
| 47. | Golden Gate | 100.0% | 13.4%(+86.6)#47 | 13.7%(+86.3)#1,134 |
| 48. | Vernon | 100.0% | 13.4%(+86.6)#48 | 13.7%(+86.3)#1,136 |
| 49. | Yale | 100.0% | 13.4%(+86.6)#49 | 13.7%(+86.3)#1,144 |
| 50. | Fowler | 100.0% | 13.4%(+86.6)#51 | 13.7%(+86.3)#1,147 |
| 51. | Longview | 100.0% | 13.4%(+86.6)#52 | 13.7%(+86.3)#1,148 |
| 52. | Deer Grove | 100.0% | 13.4%(+86.6)#53 | 13.7%(+86.3)#1,177 |
| 53. | Westervelt | 100.0% | 13.4%(+86.6)#54 | 13.7%(+86.3)#1,192 |
| 54. | Lacon | 92.3% | 13.4%(+78.9)#55 | 13.7%(+78.6)#1,220 |
| 55. | Crainville | 90.0% | 13.4%(+76.6)#56 | 13.7%(+76.3)#1,235 |
| 56. | Roxana | 87.5% | 13.4%(+74.1)#57 | 13.7%(+73.8)#1,254 |
| 57. | Taylor Springs | 87.5% | 13.4%(+74.1)#58 | 13.7%(+73.8)#1,257 |
| 58. | Ava | 87.5% | 13.4%(+74.1)#59 | 13.7%(+73.8)#1,259 |
| 59. | Winslow | 83.3% | 13.4%(+69.9)#60 | 13.7%(+69.6)#1,323 |
| 60. | Sumner | 81.8% | 13.4%(+68.4)#61 | 13.7%(+68.1)#1,339 |
| 61. | Perry | 80.0% | 13.4%(+66.6)#62 | 13.7%(+66.3)#1,383 |
| 62. | Olmsted | 80.0% | 13.4%(+66.6)#63 | 13.7%(+66.3)#1,384 |
| 63. | Christopher | 76.4% | 13.4%(+63.0)#64 | 13.7%(+62.7)#1,439 |
| 64. | Du Quoin | 75.3% | 13.4%(+61.9)#65 | 13.7%(+61.6)#1,453 |
| 65. | Morrison | 75.0% | 13.4%(+61.6)#66 | 13.7%(+61.3)#1,457 |
| 66. | Greenup | 75.0% | 13.4%(+61.6)#67 | 13.7%(+61.3)#1,462 |
| 67. | Odell | 75.0% | 13.4%(+61.6)#68 | 13.7%(+61.3)#1,469 |
| 68. | Junction City | 75.0% | 13.4%(+61.6)#69 | 13.7%(+61.3)#1,474 |
| 69. | Coalton | 75.0% | 13.4%(+61.6)#70 | 13.7%(+61.3)#1,484 |
| 70. | Kilbourne | 75.0% | 13.4%(+61.6)#71 | 13.7%(+61.3)#1,487 |
| 71. | Toulon | 73.8% | 13.4%(+60.4)#72 | 13.7%(+60.1)#1,502 |
| 72. | Newton | 72.7% | 13.4%(+59.3)#73 | 13.7%(+59.0)#1,530 |
| 73. | Chrisman | 72.7% | 13.4%(+59.3)#74 | 13.7%(+59.0)#1,533 |
| 74. | Kincaid | 71.4% | 13.4%(+58.0)#75 | 13.7%(+57.7)#1,562 |
| 75. | Murrayville | 71.4% | 13.4%(+58.0)#76 | 13.7%(+57.7)#1,569 |
| 76. | Malden | 71.4% | 13.4%(+58.0)#77 | 13.7%(+57.7)#1,574 |
| 77. | Herrick | 71.4% | 13.4%(+58.0)#78 | 13.7%(+57.7)#1,576 |
| 78. | Millbrook | 71.4% | 13.4%(+58.0)#79 | 13.7%(+57.7)#1,578 |
| 79. | Grandview | 70.6% | 13.4%(+57.2)#80 | 13.7%(+56.9)#1,593 |
| 80. | Virginia | 69.2% | 13.4%(+55.8)#81 | 13.7%(+55.5)#1,627 |
| 81. | Clay City | 69.2% | 13.4%(+55.8)#82 | 13.7%(+55.5)#1,629 |
| 82. | Bluford | 69.2% | 13.4%(+55.8)#83 | 13.7%(+55.5)#1,630 |
| 83. | Windsor | 68.8% | 13.4%(+55.4)#84 | 13.7%(+55.0)#1,638 |
| 84. | Mattoon | 67.3% | 13.4%(+53.9)#85 | 13.7%(+53.6)#1,669 |
| 85. | Spring Bay | 66.7% | 13.4%(+53.3)#86 | 13.7%(+53.0)#1,716 |
| 86. | Carbon Hill | 66.7% | 13.4%(+53.3)#87 | 13.7%(+53.0)#1,721 |
| 87. | Irving | 66.7% | 13.4%(+53.3)#88 | 13.7%(+53.0)#1,722 |
| 88. | Mason | 66.7% | 13.4%(+53.3)#89 | 13.7%(+53.0)#1,727 |
| 89. | Macomb | 65.4% | 13.4%(+52.0)#90 | 13.7%(+51.7)#1,769 |
| 90. | Rosiclare | 65.0% | 13.4%(+51.6)#91 | 13.7%(+51.3)#1,779 |
| 91. | Antioch | 63.6% | 13.4%(+50.2)#92 | 13.7%(+49.8)#1,819 |
| 92. | Weldon | 62.5% | 13.4%(+49.1)#93 | 13.7%(+48.8)#1,849 |
| 93. | New Canton | 62.5% | 13.4%(+49.1)#94 | 13.7%(+48.8)#1,851 |
| 94. | Neponset | 61.5% | 13.4%(+48.1)#95 | 13.7%(+47.8)#1,880 |
| 95. | Dallas City | 61.1% | 13.4%(+47.7)#96 | 13.7%(+47.4)#1,892 |
| 96. | Mount Carmel | 60.9% | 13.4%(+47.5)#97 | 13.7%(+47.2)#1,898 |
| 97. | Candlewick Lake | 60.7% | 13.4%(+47.3)#98 | 13.7%(+47.0)#1,904 |
| 98. | Mason City | 60.0% | 13.4%(+46.6)#99 | 13.7%(+46.3)#1,922 |
| 99. | Waverly | 60.0% | 13.4%(+46.6)#100 | 13.7%(+46.3)#1,925 |
| 100. | Worden | 60.0% | 13.4%(+46.6)#101 | 13.7%(+46.3)#1,931 |
Common Questions
What are the Top 10 Cities with the Highest Poverty Level Among Single Fathers in Illinois?
Top 10 Cities with the Highest Poverty Level Among Single Fathers in Illinois are:
#1
100.0%
#2
100.0%
#3
100.0%
#4
100.0%
#5
100.0%
#6
100.0%
#7
100.0%
#8
100.0%
#9
100.0%
#10
100.0%
What city has the Highest Poverty Level Among Single Fathers in Illinois?
Hillside has the Highest Poverty Level Among Single Fathers in Illinois with 100.0%.
What is the Poverty Level Among Single Fathers in the State of Illinois?
Poverty Level Among Single Fathers in Illinois is 13.4%.
What is the Poverty Level Among Single Fathers in the United States?
Poverty Level Among Single Fathers in the United States is 13.7%.