Cities with the Highest Poverty Level Among Single Fathers in Kentucky
RELATED REPORTS & OPTIONS
Highest Poverty | Single Father
Kentucky
Compare Cities
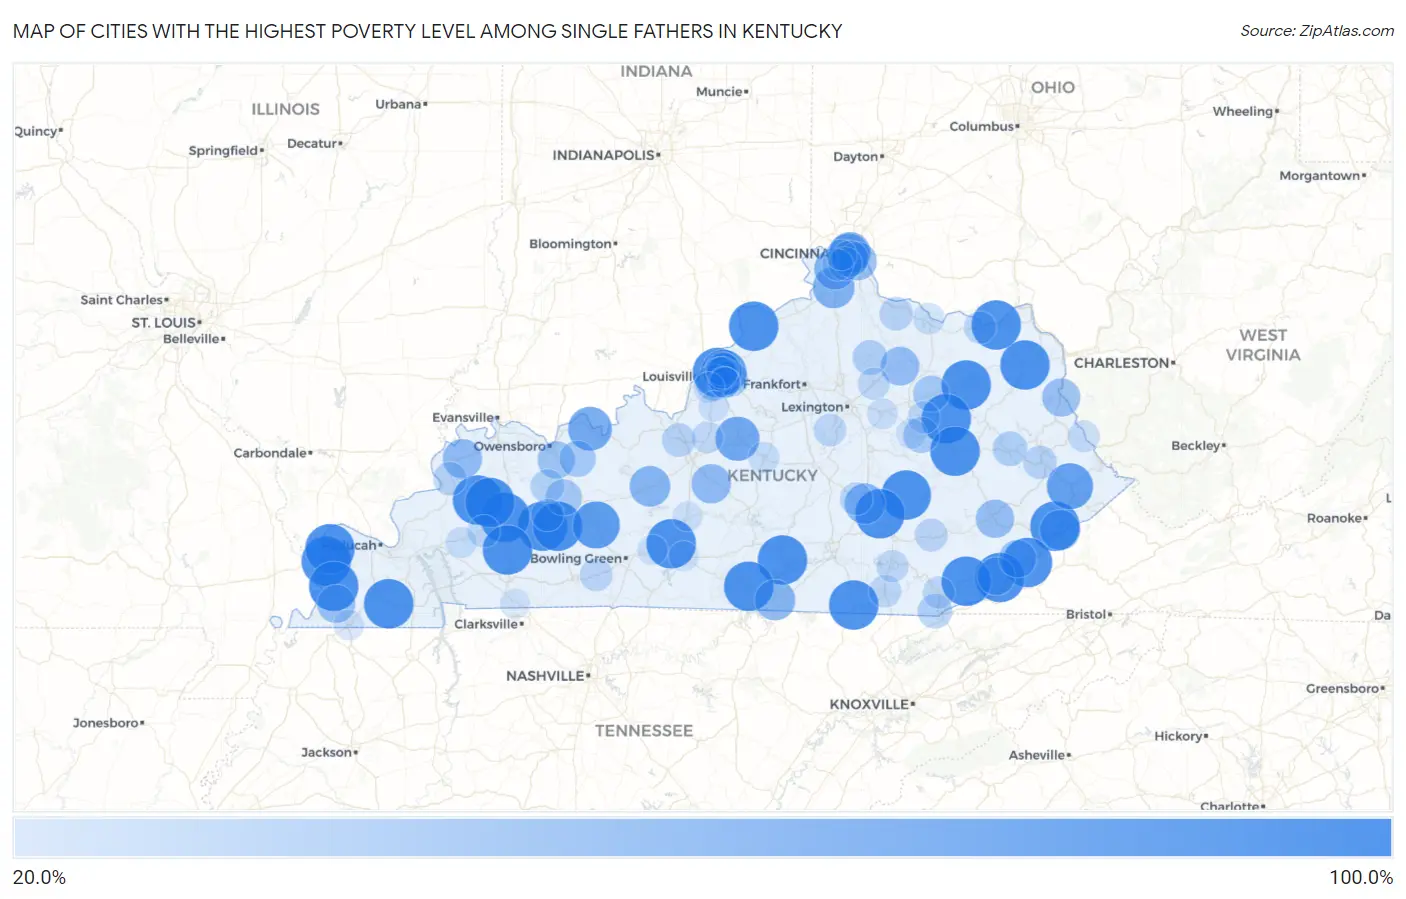
Map of Cities with the Highest Poverty Level Among Single Fathers in Kentucky
0.0%
100.0%
Cities with the Highest Poverty Level Among Single Fathers in Kentucky
| City | Single Father Poverty | vs State | vs National | |
| 1. | Morehead | 100.0% | 18.3%(+81.7)#1 | 13.7%(+86.3)#40 |
| 2. | Greenville | 100.0% | 18.3%(+81.7)#2 | 13.7%(+86.3)#95 |
| 3. | Grayson | 100.0% | 18.3%(+81.7)#3 | 13.7%(+86.3)#115 |
| 4. | Providence | 100.0% | 18.3%(+81.7)#4 | 13.7%(+86.3)#175 |
| 5. | Jamestown | 100.0% | 18.3%(+81.7)#5 | 13.7%(+86.3)#232 |
| 6. | Pine Knot | 100.0% | 18.3%(+81.7)#6 | 13.7%(+86.3)#346 |
| 7. | Burkesville | 100.0% | 18.3%(+81.7)#7 | 13.7%(+86.3)#359 |
| 8. | Earlington | 100.0% | 18.3%(+81.7)#8 | 13.7%(+86.3)#416 |
| 9. | Northfield | 100.0% | 18.3%(+81.7)#9 | 13.7%(+86.3)#442 |
| 10. | Garrison | 100.0% | 18.3%(+81.7)#10 | 13.7%(+86.3)#526 |
| 11. | Mckee | 100.0% | 18.3%(+81.7)#11 | 13.7%(+86.3)#532 |
| 12. | Frenchburg | 100.0% | 18.3%(+81.7)#12 | 13.7%(+86.3)#576 |
| 13. | Wickliffe | 100.0% | 18.3%(+81.7)#13 | 13.7%(+86.3)#596 |
| 14. | Mcroberts | 100.0% | 18.3%(+81.7)#14 | 13.7%(+86.3)#598 |
| 15. | Park City | 100.0% | 18.3%(+81.7)#15 | 13.7%(+86.3)#613 |
| 16. | Lynch | 100.0% | 18.3%(+81.7)#16 | 13.7%(+86.3)#623 |
| 17. | Barlow | 100.0% | 18.3%(+81.7)#17 | 13.7%(+86.3)#702 |
| 18. | Crofton | 100.0% | 18.3%(+81.7)#18 | 13.7%(+86.3)#709 |
| 19. | Drakesboro | 100.0% | 18.3%(+81.7)#19 | 13.7%(+86.3)#731 |
| 20. | Kenvir | 100.0% | 18.3%(+81.7)#20 | 13.7%(+86.3)#753 |
| 21. | Coldiron | 100.0% | 18.3%(+81.7)#21 | 13.7%(+86.3)#768 |
| 22. | Bedford | 100.0% | 18.3%(+81.7)#22 | 13.7%(+86.3)#881 |
| 23. | Arlington | 100.0% | 18.3%(+81.7)#23 | 13.7%(+86.3)#923 |
| 24. | Campton | 100.0% | 18.3%(+81.7)#24 | 13.7%(+86.3)#963 |
| 25. | Nebo | 100.0% | 18.3%(+81.7)#25 | 13.7%(+86.3)#1,004 |
| 26. | Farmington | 100.0% | 18.3%(+81.7)#26 | 13.7%(+86.3)#1,051 |
| 27. | Livingston | 100.0% | 18.3%(+81.7)#27 | 13.7%(+86.3)#1,066 |
| 28. | Morgantown | 90.9% | 18.3%(+72.6)#28 | 13.7%(+77.2)#1,225 |
| 29. | Pikeville | 87.1% | 18.3%(+68.8)#29 | 13.7%(+73.4)#1,265 |
| 30. | Rolling Hills | 85.0% | 18.3%(+66.7)#30 | 13.7%(+71.3)#1,292 |
| 31. | Bardstown | 79.2% | 18.3%(+60.9)#31 | 13.7%(+65.5)#1,399 |
| 32. | Hawesville | 78.5% | 18.3%(+60.2)#32 | 13.7%(+64.7)#1,415 |
| 33. | Newport | 72.2% | 18.3%(+53.9)#33 | 13.7%(+58.5)#1,545 |
| 34. | Walton | 69.8% | 18.3%(+51.5)#34 | 13.7%(+56.1)#1,617 |
| 35. | Elsmere | 69.5% | 18.3%(+51.2)#35 | 13.7%(+55.8)#1,622 |
| 36. | Bellevue | 67.2% | 18.3%(+48.9)#36 | 13.7%(+53.5)#1,671 |
| 37. | Mount Vernon | 66.7% | 18.3%(+48.4)#37 | 13.7%(+53.0)#1,684 |
| 38. | Albany | 66.7% | 18.3%(+48.4)#38 | 13.7%(+53.0)#1,685 |
| 39. | Clarkson | 66.7% | 18.3%(+48.4)#39 | 13.7%(+53.0)#1,694 |
| 40. | Jenkins | 65.2% | 18.3%(+46.9)#40 | 13.7%(+51.5)#1,774 |
| 41. | Buffalo | 61.9% | 18.3%(+43.6)#41 | 13.7%(+48.2)#1,863 |
| 42. | Morganfield | 61.3% | 18.3%(+43.0)#42 | 13.7%(+47.6)#1,886 |
| 43. | Carlisle | 58.8% | 18.3%(+40.5)#43 | 13.7%(+45.1)#1,992 |
| 44. | Silver Grove | 58.5% | 18.3%(+40.2)#44 | 13.7%(+44.8)#2,004 |
| 45. | Hazard | 57.9% | 18.3%(+39.5)#45 | 13.7%(+44.1)#2,025 |
| 46. | Louisa | 57.1% | 18.3%(+38.8)#46 | 13.7%(+43.4)#2,041 |
| 47. | Clinton | 57.1% | 18.3%(+38.8)#47 | 13.7%(+43.4)#2,052 |
| 48. | Evarts | 55.6% | 18.3%(+37.2)#48 | 13.7%(+41.8)#2,126 |
| 49. | Cumberland | 54.5% | 18.3%(+36.2)#49 | 13.7%(+40.8)#2,159 |
| 50. | Masonville | 54.2% | 18.3%(+35.9)#50 | 13.7%(+40.5)#2,185 |
| 51. | Southgate | 51.1% | 18.3%(+32.8)#51 | 13.7%(+37.4)#2,310 |
| 52. | Middletown | 50.0% | 18.3%(+31.7)#52 | 13.7%(+36.3)#2,333 |
| 53. | Owingsville | 50.0% | 18.3%(+31.7)#53 | 13.7%(+36.3)#2,358 |
| 54. | Langdon Place | 50.0% | 18.3%(+31.7)#54 | 13.7%(+36.3)#2,395 |
| 55. | Whitesville | 50.0% | 18.3%(+31.7)#55 | 13.7%(+36.3)#2,426 |
| 56. | Wellington | 50.0% | 18.3%(+31.7)#56 | 13.7%(+36.3)#2,448 |
| 57. | Centertown | 50.0% | 18.3%(+31.7)#57 | 13.7%(+36.3)#2,449 |
| 58. | Stanton | 48.4% | 18.3%(+30.1)#58 | 13.7%(+34.7)#2,550 |
| 59. | Cynthiana | 44.7% | 18.3%(+26.4)#59 | 13.7%(+31.0)#2,701 |
| 60. | Salyersville | 44.0% | 18.3%(+25.7)#60 | 13.7%(+30.3)#2,741 |
| 61. | Middlesborough | 43.6% | 18.3%(+25.3)#61 | 13.7%(+29.9)#2,758 |
| 62. | Livermore | 41.4% | 18.3%(+23.1)#62 | 13.7%(+27.7)#2,893 |
| 63. | Vine Grove | 40.2% | 18.3%(+21.9)#63 | 13.7%(+26.5)#2,943 |
| 64. | Prestonsburg | 40.0% | 18.3%(+21.7)#64 | 13.7%(+26.3)#2,955 |
| 65. | Sturgis | 40.0% | 18.3%(+21.7)#65 | 13.7%(+26.3)#2,965 |
| 66. | Brooksville | 40.0% | 18.3%(+21.7)#66 | 13.7%(+26.3)#2,979 |
| 67. | Brownsboro Farm | 40.0% | 18.3%(+21.7)#67 | 13.7%(+26.3)#2,993 |
| 68. | Covington | 39.9% | 18.3%(+21.5)#68 | 13.7%(+26.1)#3,014 |
| 69. | Graymoor Devondale | 39.0% | 18.3%(+20.7)#69 | 13.7%(+25.3)#3,056 |
| 70. | Manchester | 37.9% | 18.3%(+19.6)#70 | 13.7%(+24.2)#3,118 |
| 71. | Brodhead | 37.5% | 18.3%(+19.2)#71 | 13.7%(+23.8)#3,141 |
| 72. | Auburn | 37.0% | 18.3%(+18.7)#72 | 13.7%(+23.3)#3,184 |
| 73. | Wilmore | 36.7% | 18.3%(+18.4)#73 | 13.7%(+23.0)#3,208 |
| 74. | Dawson Springs | 36.4% | 18.3%(+18.1)#74 | 13.7%(+22.7)#3,228 |
| 75. | Central City | 36.1% | 18.3%(+17.8)#75 | 13.7%(+22.4)#3,250 |
| 76. | Jeffersonville | 36.0% | 18.3%(+17.7)#76 | 13.7%(+22.3)#3,262 |
| 77. | Williamsburg | 35.6% | 18.3%(+17.3)#77 | 13.7%(+21.9)#3,289 |
| 78. | Vanceburg | 35.5% | 18.3%(+17.2)#78 | 13.7%(+21.8)#3,296 |
| 79. | Corbin | 34.9% | 18.3%(+16.6)#79 | 13.7%(+21.2)#3,339 |
| 80. | Pineville | 34.8% | 18.3%(+16.5)#80 | 13.7%(+21.1)#3,350 |
| 81. | Paris | 34.5% | 18.3%(+16.2)#81 | 13.7%(+20.8)#3,373 |
| 82. | Lebanon Junction | 34.1% | 18.3%(+15.8)#82 | 13.7%(+20.4)#3,402 |
| 83. | Forest Hills | 33.3% | 18.3%(+15.0)#83 | 13.7%(+19.6)#3,523 |
| 84. | Briarwood | 33.3% | 18.3%(+15.0)#84 | 13.7%(+19.6)#3,533 |
| 85. | Warfield | 33.3% | 18.3%(+15.0)#85 | 13.7%(+19.6)#3,546 |
| 86. | Maysville | 32.1% | 18.3%(+13.8)#86 | 13.7%(+18.4)#3,614 |
| 87. | Springfield | 31.9% | 18.3%(+13.6)#87 | 13.7%(+18.2)#3,630 |
| 88. | Erlanger | 31.9% | 18.3%(+13.6)#88 | 13.7%(+18.2)#3,631 |
| 89. | Princeton | 31.1% | 18.3%(+12.8)#89 | 13.7%(+17.4)#3,690 |
| 90. | Winchester | 30.1% | 18.3%(+11.8)#90 | 13.7%(+16.4)#3,786 |
| 91. | Lynnview | 30.0% | 18.3%(+11.7)#91 | 13.7%(+16.3)#3,807 |
| 92. | Ludlow | 29.9% | 18.3%(+11.5)#92 | 13.7%(+16.1)#3,821 |
| 93. | Fulton | 29.2% | 18.3%(+10.9)#93 | 13.7%(+15.5)#3,872 |
| 94. | Hebron Estates | 29.2% | 18.3%(+10.9)#94 | 13.7%(+15.5)#3,873 |
| 95. | Jeffersontown | 29.1% | 18.3%(+10.8)#95 | 13.7%(+15.4)#3,876 |
| 96. | Clay City | 28.8% | 18.3%(+10.5)#96 | 13.7%(+15.1)#3,895 |
| 97. | Smiths Grove | 28.6% | 18.3%(+10.3)#97 | 13.7%(+14.9)#3,921 |
| 98. | Glasgow | 28.2% | 18.3%(+9.91)#98 | 13.7%(+14.5)#3,955 |
| 99. | Oak Grove | 28.0% | 18.3%(+9.69)#99 | 13.7%(+14.3)#3,968 |
| 100. | Munfordville | 27.8% | 18.3%(+9.47)#100 | 13.7%(+14.1)#3,993 |
Common Questions
What are the Top 10 Cities with the Highest Poverty Level Among Single Fathers in Kentucky?
Top 10 Cities with the Highest Poverty Level Among Single Fathers in Kentucky are:
#1
100.0%
#2
100.0%
#3
100.0%
#4
100.0%
#5
100.0%
#6
100.0%
#7
100.0%
#8
100.0%
#9
100.0%
#10
100.0%
What city has the Highest Poverty Level Among Single Fathers in Kentucky?
Morehead has the Highest Poverty Level Among Single Fathers in Kentucky with 100.0%.
What is the Poverty Level Among Single Fathers in the State of Kentucky?
Poverty Level Among Single Fathers in Kentucky is 18.3%.
What is the Poverty Level Among Single Fathers in the United States?
Poverty Level Among Single Fathers in the United States is 13.7%.