Cities with the Highest Poverty Level Among Single Fathers in Ohio
RELATED REPORTS & OPTIONS
Highest Poverty | Single Father
Ohio
Compare Cities
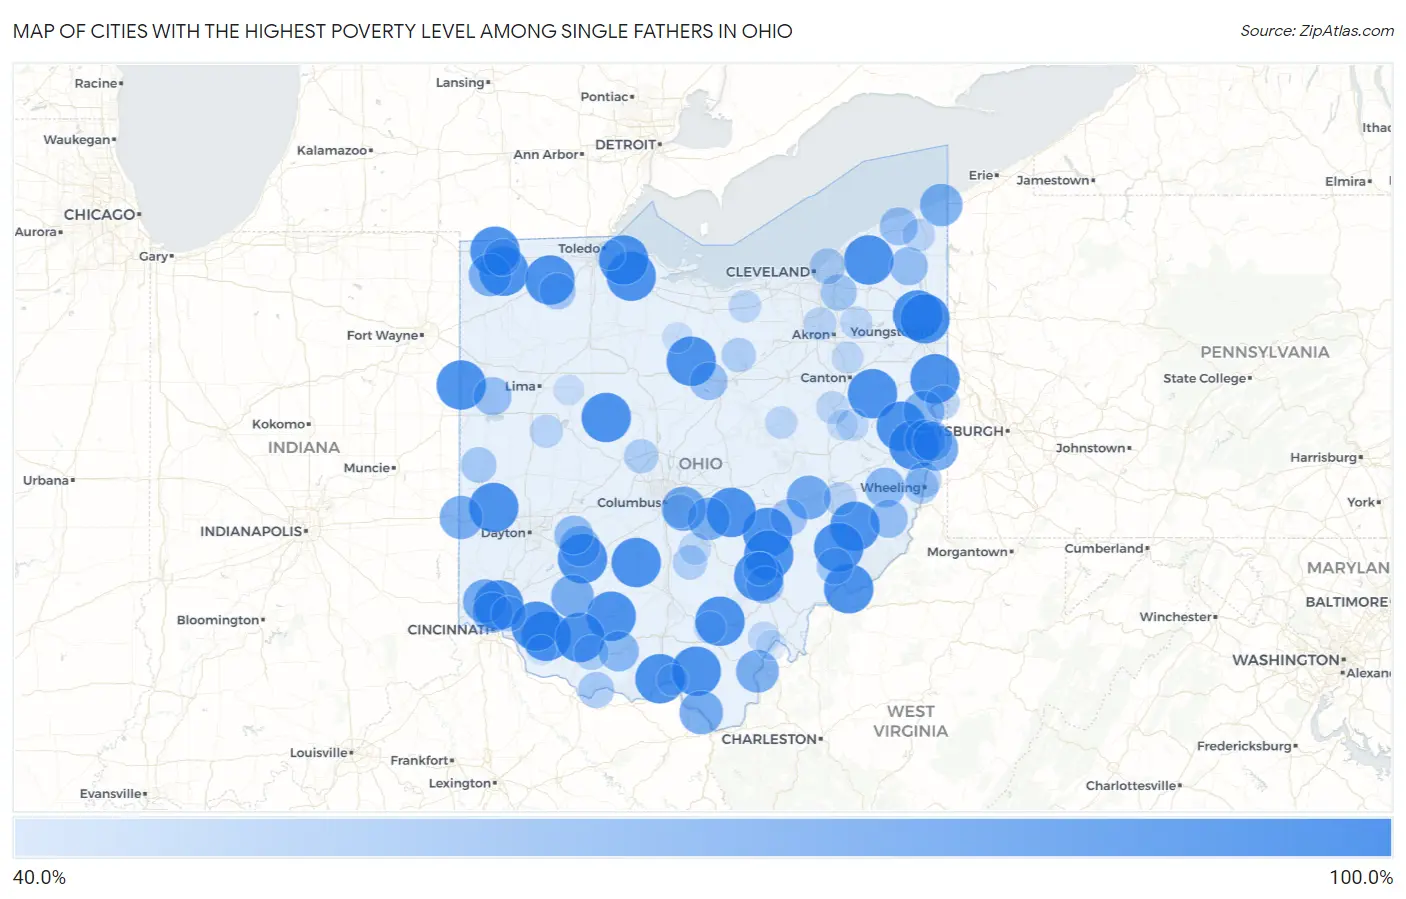
Map of Cities with the Highest Poverty Level Among Single Fathers in Ohio
0.0%
100.0%
Cities with the Highest Poverty Level Among Single Fathers in Ohio
| City | Single Father Poverty | vs State | vs National | |
| 1. | Chardon | 100.0% | 14.6%(+85.4)#1 | 13.7%(+86.3)#71 |
| 2. | Williamsburg | 100.0% | 14.6%(+85.4)#2 | 13.7%(+86.3)#212 |
| 3. | West Portsmouth | 100.0% | 14.6%(+85.4)#3 | 13.7%(+86.3)#214 |
| 4. | Crooksville | 100.0% | 14.6%(+85.4)#4 | 13.7%(+86.3)#236 |
| 5. | Glendale | 100.0% | 14.6%(+85.4)#5 | 13.7%(+86.3)#250 |
| 6. | Bolindale | 100.0% | 14.6%(+85.4)#6 | 13.7%(+86.3)#268 |
| 7. | Elmore | 100.0% | 14.6%(+85.4)#7 | 13.7%(+86.3)#331 |
| 8. | Thornville | 100.0% | 14.6%(+85.4)#8 | 13.7%(+86.3)#333 |
| 9. | Malvern | 100.0% | 14.6%(+85.4)#9 | 13.7%(+86.3)#337 |
| 10. | Stryker | 100.0% | 14.6%(+85.4)#10 | 13.7%(+86.3)#366 |
| 11. | Reno | 100.0% | 14.6%(+85.4)#11 | 13.7%(+86.3)#394 |
| 12. | North Lima | 100.0% | 14.6%(+85.4)#12 | 13.7%(+86.3)#444 |
| 13. | Liberty Center | 100.0% | 14.6%(+85.4)#13 | 13.7%(+86.3)#491 |
| 14. | Highland Holiday | 100.0% | 14.6%(+85.4)#14 | 13.7%(+86.3)#506 |
| 15. | Mckinley Heights | 100.0% | 14.6%(+85.4)#15 | 13.7%(+86.3)#510 |
| 16. | New Holland | 100.0% | 14.6%(+85.4)#16 | 13.7%(+86.3)#521 |
| 17. | Owensville | 100.0% | 14.6%(+85.4)#17 | 13.7%(+86.3)#562 |
| 18. | South Webster | 100.0% | 14.6%(+85.4)#18 | 13.7%(+86.3)#587 |
| 19. | Hamden | 100.0% | 14.6%(+85.4)#19 | 13.7%(+86.3)#627 |
| 20. | Mount Victory | 100.0% | 14.6%(+85.4)#20 | 13.7%(+86.3)#650 |
| 21. | Reno Beach | 100.0% | 14.6%(+85.4)#21 | 13.7%(+86.3)#672 |
| 22. | Corning | 100.0% | 14.6%(+85.4)#22 | 13.7%(+86.3)#746 |
| 23. | Mowrystown | 100.0% | 14.6%(+85.4)#23 | 13.7%(+86.3)#752 |
| 24. | Amsterdam | 100.0% | 14.6%(+85.4)#24 | 13.7%(+86.3)#781 |
| 25. | Buchtel | 100.0% | 14.6%(+85.4)#25 | 13.7%(+86.3)#789 |
| 26. | Willshire | 100.0% | 14.6%(+85.4)#26 | 13.7%(+86.3)#808 |
| 27. | Hamburg | 100.0% | 14.6%(+85.4)#27 | 13.7%(+86.3)#812 |
| 28. | Clay Center | 100.0% | 14.6%(+85.4)#28 | 13.7%(+86.3)#831 |
| 29. | Nashport | 100.0% | 14.6%(+85.4)#29 | 13.7%(+86.3)#873 |
| 30. | Bowersville | 100.0% | 14.6%(+85.4)#30 | 13.7%(+86.3)#890 |
| 31. | Rogers | 100.0% | 14.6%(+85.4)#31 | 13.7%(+86.3)#941 |
| 32. | Gordon | 100.0% | 14.6%(+85.4)#32 | 13.7%(+86.3)#950 |
| 33. | Tiro | 100.0% | 14.6%(+85.4)#33 | 13.7%(+86.3)#956 |
| 34. | Kunkle | 100.0% | 14.6%(+85.4)#34 | 13.7%(+86.3)#983 |
| 35. | Summerfield | 100.0% | 14.6%(+85.4)#35 | 13.7%(+86.3)#1,008 |
| 36. | Dexter City | 100.0% | 14.6%(+85.4)#36 | 13.7%(+86.3)#1,101 |
| 37. | Bloomingdale | 100.0% | 14.6%(+85.4)#37 | 13.7%(+86.3)#1,123 |
| 38. | Brice | 84.6% | 14.6%(+70.0)#38 | 13.7%(+70.9)#1,298 |
| 39. | Mingo Junction | 83.7% | 14.6%(+69.0)#39 | 13.7%(+70.0)#1,308 |
| 40. | Pleasant Run | 83.3% | 14.6%(+68.7)#40 | 13.7%(+69.6)#1,310 |
| 41. | New Concord | 83.3% | 14.6%(+68.7)#41 | 13.7%(+69.6)#1,312 |
| 42. | Ironton | 82.5% | 14.6%(+67.9)#42 | 13.7%(+68.8)#1,330 |
| 43. | New Paris | 81.2% | 14.6%(+66.6)#43 | 13.7%(+67.5)#1,351 |
| 44. | Gallipolis | 80.4% | 14.6%(+65.7)#44 | 13.7%(+66.6)#1,361 |
| 45. | Martinsville | 80.0% | 14.6%(+65.4)#45 | 13.7%(+66.3)#1,379 |
| 46. | Bryan | 79.7% | 14.6%(+65.1)#46 | 13.7%(+66.0)#1,390 |
| 47. | Conneaut | 79.4% | 14.6%(+64.8)#47 | 13.7%(+65.7)#1,397 |
| 48. | Baltimore | 79.2% | 14.6%(+64.6)#48 | 13.7%(+65.5)#1,398 |
| 49. | Irondale | 75.0% | 14.6%(+60.4)#49 | 13.7%(+61.3)#1,486 |
| 50. | Wintersville | 74.3% | 14.6%(+59.6)#50 | 13.7%(+60.6)#1,498 |
| 51. | Finneytown | 73.3% | 14.6%(+58.7)#51 | 13.7%(+59.6)#1,512 |
| 52. | Jamestown | 73.0% | 14.6%(+58.3)#52 | 13.7%(+59.3)#1,527 |
| 53. | Peebles | 72.7% | 14.6%(+58.1)#53 | 13.7%(+59.0)#1,532 |
| 54. | Morristown | 71.4% | 14.6%(+56.8)#54 | 13.7%(+57.7)#1,579 |
| 55. | Steubenville | 71.0% | 14.6%(+56.3)#55 | 13.7%(+57.3)#1,586 |
| 56. | Cedarville | 68.8% | 14.6%(+54.1)#56 | 13.7%(+55.0)#1,636 |
| 57. | Orwell | 66.7% | 14.6%(+52.0)#57 | 13.7%(+53.0)#1,691 |
| 58. | Mendon | 66.7% | 14.6%(+52.0)#58 | 13.7%(+53.0)#1,706 |
| 59. | Beallsville | 66.7% | 14.6%(+52.0)#59 | 13.7%(+53.0)#1,725 |
| 60. | Geneva | 66.0% | 14.6%(+51.3)#60 | 13.7%(+52.2)#1,759 |
| 61. | Ontario | 65.3% | 14.6%(+50.7)#61 | 13.7%(+51.6)#1,771 |
| 62. | Chauncey | 64.5% | 14.6%(+49.9)#62 | 13.7%(+50.8)#1,785 |
| 63. | Philo | 63.6% | 14.6%(+49.0)#63 | 13.7%(+49.9)#1,816 |
| 64. | West Unity | 63.0% | 14.6%(+48.4)#64 | 13.7%(+49.3)#1,828 |
| 65. | Mcclure | 61.5% | 14.6%(+46.9)#65 | 13.7%(+47.8)#1,875 |
| 66. | Lowell | 61.5% | 14.6%(+46.9)#66 | 13.7%(+47.8)#1,879 |
| 67. | Glenwillow | 61.1% | 14.6%(+46.5)#67 | 13.7%(+47.4)#1,891 |
| 68. | Manchester | 60.5% | 14.6%(+45.9)#68 | 13.7%(+46.8)#1,913 |
| 69. | East Cleveland | 59.5% | 14.6%(+44.8)#69 | 13.7%(+45.8)#1,969 |
| 70. | Ansonia | 59.1% | 14.6%(+44.5)#70 | 13.7%(+45.4)#1,982 |
| 71. | Kenwood | 58.2% | 14.6%(+43.6)#71 | 13.7%(+44.5)#2,019 |
| 72. | Martins Ferry | 58.2% | 14.6%(+43.6)#72 | 13.7%(+44.5)#2,020 |
| 73. | Bridgeport | 57.1% | 14.6%(+42.5)#73 | 13.7%(+43.4)#2,047 |
| 74. | Winchester | 57.1% | 14.6%(+42.5)#74 | 13.7%(+43.4)#2,050 |
| 75. | Ostrander | 55.6% | 14.6%(+40.9)#75 | 13.7%(+41.8)#2,124 |
| 76. | Bailey Lakes | 55.6% | 14.6%(+40.9)#76 | 13.7%(+41.8)#2,133 |
| 77. | Tarlton | 55.6% | 14.6%(+40.9)#77 | 13.7%(+41.8)#2,135 |
| 78. | East Liverpool | 54.8% | 14.6%(+40.2)#78 | 13.7%(+41.1)#2,151 |
| 79. | Blacklick Estates | 53.6% | 14.6%(+38.9)#79 | 13.7%(+39.9)#2,208 |
| 80. | Murray City | 53.3% | 14.6%(+38.7)#80 | 13.7%(+39.6)#2,227 |
| 81. | Lore City | 52.5% | 14.6%(+37.9)#81 | 13.7%(+38.8)#2,258 |
| 82. | Jackson Center | 51.9% | 14.6%(+37.2)#82 | 13.7%(+38.1)#2,281 |
| 83. | Montrose Ghent | 51.8% | 14.6%(+37.1)#83 | 13.7%(+38.0)#2,290 |
| 84. | Strasburg | 51.3% | 14.6%(+36.6)#84 | 13.7%(+37.6)#2,303 |
| 85. | Jefferson | 50.9% | 14.6%(+36.2)#85 | 13.7%(+37.2)#2,315 |
| 86. | Killbuck | 50.0% | 14.6%(+35.4)#86 | 13.7%(+36.3)#2,394 |
| 87. | Brady Lake | 50.0% | 14.6%(+35.4)#87 | 13.7%(+36.3)#2,399 |
| 88. | Amanda | 50.0% | 14.6%(+35.4)#88 | 13.7%(+36.3)#2,403 |
| 89. | Coalton | 50.0% | 14.6%(+35.4)#89 | 13.7%(+36.3)#2,451 |
| 90. | Roswell | 50.0% | 14.6%(+35.4)#90 | 13.7%(+36.3)#2,488 |
| 91. | Kipton | 50.0% | 14.6%(+35.4)#91 | 13.7%(+36.3)#2,491 |
| 92. | Greentown | 48.8% | 14.6%(+34.2)#92 | 13.7%(+35.1)#2,539 |
| 93. | Rutland | 48.6% | 14.6%(+34.0)#93 | 13.7%(+34.9)#2,544 |
| 94. | Portsmouth | 47.7% | 14.6%(+33.1)#94 | 13.7%(+34.0)#2,575 |
| 95. | New Philadelphia | 46.3% | 14.6%(+31.7)#95 | 13.7%(+32.6)#2,632 |
| 96. | Alger | 45.5% | 14.6%(+30.8)#96 | 13.7%(+31.7)#2,673 |
| 97. | Attica | 45.5% | 14.6%(+30.8)#97 | 13.7%(+31.7)#2,674 |
| 98. | Bethel | 43.8% | 14.6%(+29.1)#98 | 13.7%(+30.0)#2,752 |
| 99. | Middleport | 43.5% | 14.6%(+28.8)#99 | 13.7%(+29.8)#2,767 |
| 100. | Northwood | 43.4% | 14.6%(+28.8)#100 | 13.7%(+29.7)#2,770 |
Common Questions
What are the Top 10 Cities with the Highest Poverty Level Among Single Fathers in Ohio?
Top 10 Cities with the Highest Poverty Level Among Single Fathers in Ohio are:
#1
100.0%
#2
100.0%
#3
100.0%
#4
100.0%
#5
100.0%
#6
100.0%
#7
100.0%
#8
100.0%
#9
100.0%
#10
100.0%
What city has the Highest Poverty Level Among Single Fathers in Ohio?
Chardon has the Highest Poverty Level Among Single Fathers in Ohio with 100.0%.
What is the Poverty Level Among Single Fathers in the State of Ohio?
Poverty Level Among Single Fathers in Ohio is 14.6%.
What is the Poverty Level Among Single Fathers in the United States?
Poverty Level Among Single Fathers in the United States is 13.7%.