Cities with the Highest Poverty Level Among Single Fathers in North Carolina
RELATED REPORTS & OPTIONS
Highest Poverty | Single Father
North Carolina
Compare Cities
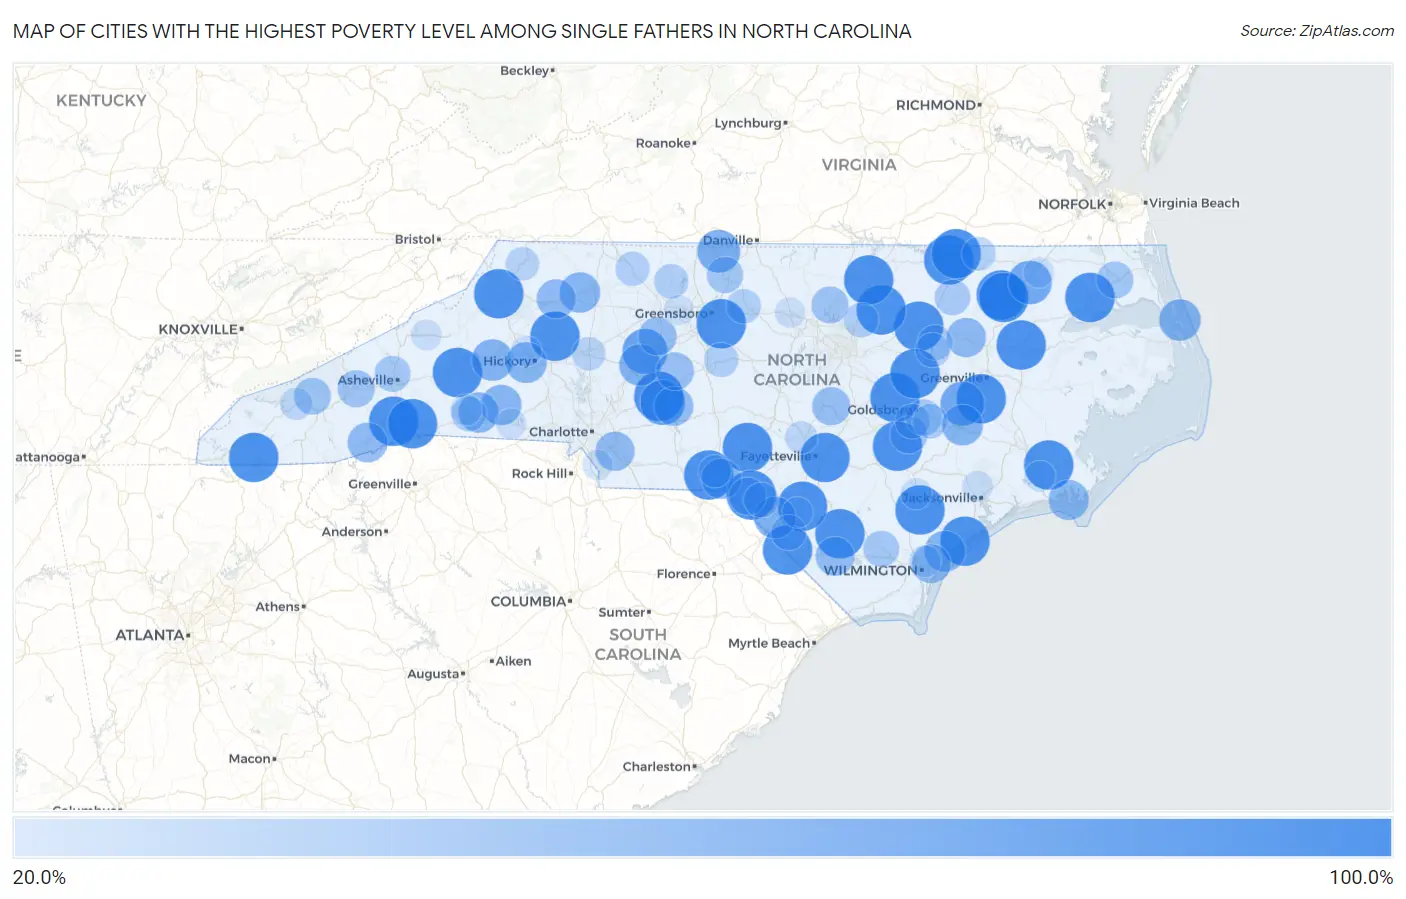
Map of Cities with the Highest Poverty Level Among Single Fathers in North Carolina
0.0%
100.0%
Cities with the Highest Poverty Level Among Single Fathers in North Carolina
| City | Single Father Poverty | vs State | vs National | |
| 1. | Boone | 100.0% | 16.3%(+83.7)#1 | 13.7%(+86.3)#2 |
| 2. | Etowah | 100.0% | 16.3%(+83.7)#2 | 13.7%(+86.3)#30 |
| 3. | East Flat Rock | 100.0% | 16.3%(+83.7)#3 | 13.7%(+86.3)#53 |
| 4. | Nashville | 100.0% | 16.3%(+83.7)#4 | 13.7%(+86.3)#61 |
| 5. | Williamston | 100.0% | 16.3%(+83.7)#5 | 13.7%(+86.3)#72 |
| 6. | Ayden | 100.0% | 16.3%(+83.7)#6 | 13.7%(+86.3)#78 |
| 7. | Forest Oaks | 100.0% | 16.3%(+83.7)#7 | 13.7%(+86.3)#106 |
| 8. | Surf City | 100.0% | 16.3%(+83.7)#8 | 13.7%(+86.3)#113 |
| 9. | Louisburg | 100.0% | 16.3%(+83.7)#9 | 13.7%(+86.3)#164 |
| 10. | South Rosemary | 100.0% | 16.3%(+83.7)#10 | 13.7%(+86.3)#176 |
| 11. | Taylorsville | 100.0% | 16.3%(+83.7)#11 | 13.7%(+86.3)#248 |
| 12. | Hertford | 100.0% | 16.3%(+83.7)#12 | 13.7%(+86.3)#260 |
| 13. | Pinebluff | 100.0% | 16.3%(+83.7)#13 | 13.7%(+86.3)#297 |
| 14. | Vander | 100.0% | 16.3%(+83.7)#14 | 13.7%(+86.3)#349 |
| 15. | Princeton | 100.0% | 16.3%(+83.7)#15 | 13.7%(+86.3)#352 |
| 16. | Cordova | 100.0% | 16.3%(+83.7)#16 | 13.7%(+86.3)#385 |
| 17. | South Henderson | 100.0% | 16.3%(+83.7)#17 | 13.7%(+86.3)#425 |
| 18. | Lucama | 100.0% | 16.3%(+83.7)#18 | 13.7%(+86.3)#460 |
| 19. | Faison | 100.0% | 16.3%(+83.7)#19 | 13.7%(+86.3)#503 |
| 20. | Richfield | 100.0% | 16.3%(+83.7)#20 | 13.7%(+86.3)#517 |
| 21. | West Marion | 100.0% | 16.3%(+83.7)#21 | 13.7%(+86.3)#520 |
| 22. | Gaston | 100.0% | 16.3%(+83.7)#22 | 13.7%(+86.3)#536 |
| 23. | Clarkton | 100.0% | 16.3%(+83.7)#23 | 13.7%(+86.3)#548 |
| 24. | Barker Ten Mile | 100.0% | 16.3%(+83.7)#24 | 13.7%(+86.3)#571 |
| 25. | Hayesville | 100.0% | 16.3%(+83.7)#25 | 13.7%(+86.3)#646 |
| 26. | Minnesott Beach | 100.0% | 16.3%(+83.7)#26 | 13.7%(+86.3)#736 |
| 27. | Roxobel | 100.0% | 16.3%(+83.7)#27 | 13.7%(+86.3)#764 |
| 28. | East Laurinburg | 100.0% | 16.3%(+83.7)#28 | 13.7%(+86.3)#861 |
| 29. | Kelford | 100.0% | 16.3%(+83.7)#29 | 13.7%(+86.3)#904 |
| 30. | Watha | 100.0% | 16.3%(+83.7)#30 | 13.7%(+86.3)#974 |
| 31. | Marietta | 100.0% | 16.3%(+83.7)#31 | 13.7%(+86.3)#1,110 |
| 32. | Tyro | 83.3% | 16.3%(+67.0)#32 | 13.7%(+69.6)#1,311 |
| 33. | New London | 83.3% | 16.3%(+67.0)#33 | 13.7%(+69.6)#1,316 |
| 34. | Hookerton | 80.0% | 16.3%(+63.7)#34 | 13.7%(+66.3)#1,378 |
| 35. | Ahoskie | 78.3% | 16.3%(+61.9)#35 | 13.7%(+64.5)#1,417 |
| 36. | Eden | 75.7% | 16.3%(+59.3)#36 | 13.7%(+61.9)#1,450 |
| 37. | Elrod | 71.4% | 16.3%(+55.1)#37 | 13.7%(+57.7)#1,581 |
| 38. | Morganton | 70.6% | 16.3%(+54.3)#38 | 13.7%(+56.9)#1,592 |
| 39. | Kill Devil Hills | 70.5% | 16.3%(+54.1)#39 | 13.7%(+56.8)#1,598 |
| 40. | Spencer | 70.5% | 16.3%(+54.1)#40 | 13.7%(+56.7)#1,599 |
| 41. | Hildebran | 68.8% | 16.3%(+52.4)#41 | 13.7%(+55.0)#1,637 |
| 42. | Kinston | 67.9% | 16.3%(+51.6)#42 | 13.7%(+54.2)#1,657 |
| 43. | Hampstead | 67.9% | 16.3%(+51.5)#43 | 13.7%(+54.2)#1,658 |
| 44. | Ronda | 66.7% | 16.3%(+50.3)#44 | 13.7%(+53.0)#1,713 |
| 45. | Polkville | 66.7% | 16.3%(+50.3)#45 | 13.7%(+53.0)#1,715 |
| 46. | Bostic | 66.7% | 16.3%(+50.3)#46 | 13.7%(+53.0)#1,733 |
| 47. | Hamlet | 65.5% | 16.3%(+49.2)#47 | 13.7%(+51.8)#1,766 |
| 48. | Beaufort | 65.1% | 16.3%(+48.8)#48 | 13.7%(+51.4)#1,775 |
| 49. | Rosman | 63.6% | 16.3%(+47.3)#49 | 13.7%(+49.9)#1,817 |
| 50. | Tarboro | 62.9% | 16.3%(+46.6)#50 | 13.7%(+49.2)#1,831 |
| 51. | Lake Park | 61.8% | 16.3%(+45.4)#51 | 13.7%(+48.1)#1,868 |
| 52. | North Wilkesboro | 61.7% | 16.3%(+45.4)#52 | 13.7%(+48.0)#1,869 |
| 53. | Badin | 61.5% | 16.3%(+45.2)#53 | 13.7%(+47.8)#1,873 |
| 54. | Kings Grant | 61.2% | 16.3%(+44.9)#54 | 13.7%(+47.5)#1,887 |
| 55. | Whiteville | 60.6% | 16.3%(+44.3)#55 | 13.7%(+46.9)#1,910 |
| 56. | Welcome | 59.0% | 16.3%(+42.7)#56 | 13.7%(+45.3)#1,984 |
| 57. | Buies Creek | 58.2% | 16.3%(+41.9)#57 | 13.7%(+44.5)#2,021 |
| 58. | Denton | 57.1% | 16.3%(+40.8)#58 | 13.7%(+43.4)#2,049 |
| 59. | Laurinburg | 54.7% | 16.3%(+38.3)#59 | 13.7%(+41.0)#2,154 |
| 60. | Clyde | 54.5% | 16.3%(+38.2)#60 | 13.7%(+40.8)#2,163 |
| 61. | Mount Olive | 54.2% | 16.3%(+37.8)#61 | 13.7%(+40.5)#2,182 |
| 62. | Butner | 54.1% | 16.3%(+37.7)#62 | 13.7%(+40.3)#2,187 |
| 63. | Cherokee | 53.5% | 16.3%(+37.1)#63 | 13.7%(+39.8)#2,215 |
| 64. | Elizabeth City | 53.2% | 16.3%(+36.9)#64 | 13.7%(+39.5)#2,230 |
| 65. | Reidsville | 51.4% | 16.3%(+35.0)#65 | 13.7%(+37.6)#2,300 |
| 66. | Elroy | 50.8% | 16.3%(+34.4)#66 | 13.7%(+37.1)#2,320 |
| 67. | Woodfin | 50.0% | 16.3%(+33.7)#67 | 13.7%(+36.3)#2,335 |
| 68. | Sandyfield | 50.0% | 16.3%(+33.7)#68 | 13.7%(+36.3)#2,418 |
| 69. | Enfield | 48.6% | 16.3%(+32.2)#69 | 13.7%(+34.9)#2,546 |
| 70. | Fairmont | 47.8% | 16.3%(+31.5)#70 | 13.7%(+34.1)#2,571 |
| 71. | Spindale | 47.1% | 16.3%(+30.7)#71 | 13.7%(+33.3)#2,598 |
| 72. | Sharpsburg | 46.3% | 16.3%(+29.9)#72 | 13.7%(+32.6)#2,634 |
| 73. | Brogden | 45.7% | 16.3%(+29.4)#73 | 13.7%(+32.0)#2,660 |
| 74. | Maxton | 45.5% | 16.3%(+29.1)#74 | 13.7%(+31.7)#2,668 |
| 75. | Walnut Creek | 45.5% | 16.3%(+29.1)#75 | 13.7%(+31.7)#2,670 |
| 76. | Youngsville | 45.1% | 16.3%(+28.8)#76 | 13.7%(+31.4)#2,688 |
| 77. | Walnut Cove | 45.0% | 16.3%(+28.7)#77 | 13.7%(+31.3)#2,695 |
| 78. | Elon | 44.4% | 16.3%(+28.1)#78 | 13.7%(+30.7)#2,709 |
| 79. | Franklinville | 44.4% | 16.3%(+28.1)#79 | 13.7%(+30.7)#2,716 |
| 80. | Elm City | 44.4% | 16.3%(+28.1)#80 | 13.7%(+30.7)#2,717 |
| 81. | Pilot Mountain | 43.3% | 16.3%(+27.0)#81 | 13.7%(+29.6)#2,773 |
| 82. | Seaboard | 42.1% | 16.3%(+25.8)#82 | 13.7%(+28.4)#2,853 |
| 83. | Statesville | 41.4% | 16.3%(+25.0)#83 | 13.7%(+27.7)#2,890 |
| 84. | Jefferson | 40.8% | 16.3%(+24.5)#84 | 13.7%(+27.1)#2,918 |
| 85. | Spring Lake | 37.9% | 16.3%(+21.6)#85 | 13.7%(+24.2)#3,119 |
| 86. | Rockingham | 37.1% | 16.3%(+20.8)#86 | 13.7%(+23.4)#3,173 |
| 87. | Bryson City | 36.4% | 16.3%(+20.0)#87 | 13.7%(+22.7)#3,229 |
| 88. | Wrightsboro | 34.7% | 16.3%(+18.4)#88 | 13.7%(+21.0)#3,355 |
| 89. | Ruth | 33.3% | 16.3%(+17.0)#89 | 13.7%(+19.6)#3,503 |
| 90. | Teachey | 32.5% | 16.3%(+16.2)#90 | 13.7%(+18.8)#3,595 |
| 91. | Half Moon | 32.1% | 16.3%(+15.8)#91 | 13.7%(+18.4)#3,618 |
| 92. | Havelock | 31.7% | 16.3%(+15.4)#92 | 13.7%(+18.0)#3,649 |
| 93. | Burnsville | 31.1% | 16.3%(+14.8)#93 | 13.7%(+17.4)#3,692 |
| 94. | Lumberton | 30.9% | 16.3%(+14.6)#94 | 13.7%(+17.2)#3,709 |
| 95. | Shelby | 30.8% | 16.3%(+14.4)#95 | 13.7%(+17.1)#3,718 |
| 96. | Granite Falls | 30.8% | 16.3%(+14.4)#96 | 13.7%(+17.1)#3,722 |
| 97. | Cofield | 30.4% | 16.3%(+14.1)#97 | 13.7%(+16.7)#3,760 |
| 98. | Hillsborough | 30.3% | 16.3%(+14.0)#98 | 13.7%(+16.6)#3,767 |
| 99. | Marvin | 30.0% | 16.3%(+13.7)#99 | 13.7%(+16.3)#3,788 |
| 100. | Kernersville | 29.2% | 16.3%(+12.9)#100 | 13.7%(+15.5)#3,867 |
Common Questions
What are the Top 10 Cities with the Highest Poverty Level Among Single Fathers in North Carolina?
Top 10 Cities with the Highest Poverty Level Among Single Fathers in North Carolina are:
#1
100.0%
#2
100.0%
#3
100.0%
#4
100.0%
#5
100.0%
#6
100.0%
#7
100.0%
#8
100.0%
#9
100.0%
#10
100.0%
What city has the Highest Poverty Level Among Single Fathers in North Carolina?
Boone has the Highest Poverty Level Among Single Fathers in North Carolina with 100.0%.
What is the Poverty Level Among Single Fathers in the State of North Carolina?
Poverty Level Among Single Fathers in North Carolina is 16.3%.
What is the Poverty Level Among Single Fathers in the United States?
Poverty Level Among Single Fathers in the United States is 13.7%.