Cities with the Highest Poverty Level Among Single Fathers in Virginia
RELATED REPORTS & OPTIONS
Highest Poverty | Single Father
Virginia
Compare Cities
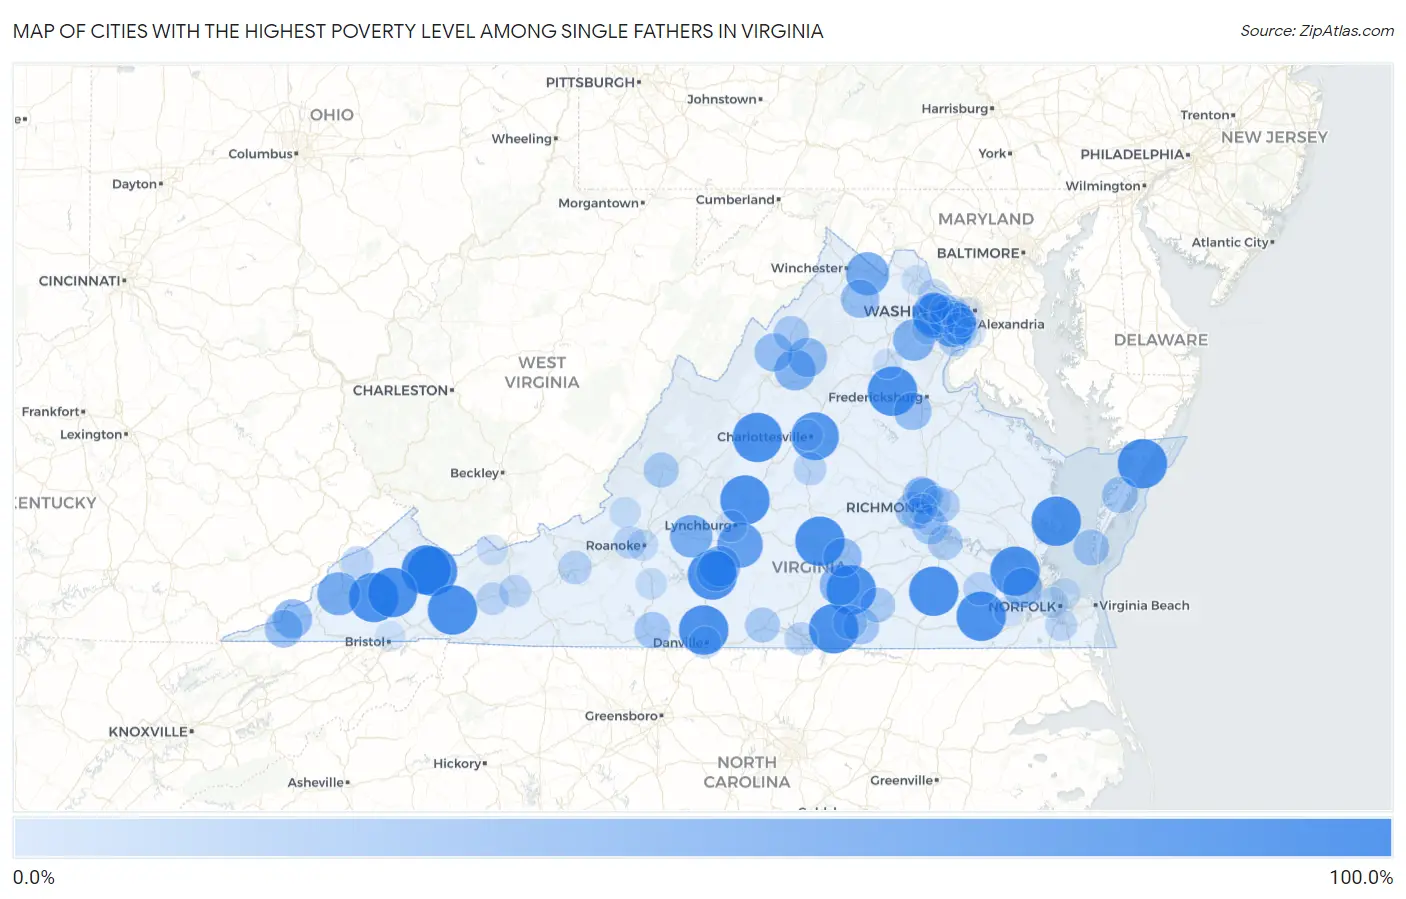
Map of Cities with the Highest Poverty Level Among Single Fathers in Virginia
0.0%
100.0%
Cities with the Highest Poverty Level Among Single Fathers in Virginia
| City | Single Father Poverty | vs State | vs National | |
| 1. | Lake Of The Woods | 100.0% | 10.5%(+89.5)#1 | 13.7%(+86.3)#23 |
| 2. | Farmville | 100.0% | 10.5%(+89.5)#2 | 13.7%(+86.3)#31 |
| 3. | Richlands | 100.0% | 10.5%(+89.5)#3 | 13.7%(+86.3)#70 |
| 4. | Mount Hermon | 100.0% | 10.5%(+89.5)#4 | 13.7%(+86.3)#97 |
| 5. | Amherst | 100.0% | 10.5%(+89.5)#5 | 13.7%(+86.3)#237 |
| 6. | Raven | 100.0% | 10.5%(+89.5)#6 | 13.7%(+86.3)#255 |
| 7. | Lyndhurst | 100.0% | 10.5%(+89.5)#7 | 13.7%(+86.3)#302 |
| 8. | Kenbridge | 100.0% | 10.5%(+89.5)#8 | 13.7%(+86.3)#365 |
| 9. | St Paul | 100.0% | 10.5%(+89.5)#9 | 13.7%(+86.3)#437 |
| 10. | Mathews | 100.0% | 10.5%(+89.5)#10 | 13.7%(+86.3)#448 |
| 11. | Rushmere | 100.0% | 10.5%(+89.5)#11 | 13.7%(+86.3)#523 |
| 12. | Motley | 100.0% | 10.5%(+89.5)#12 | 13.7%(+86.3)#574 |
| 13. | Seven Mile Ford | 100.0% | 10.5%(+89.5)#13 | 13.7%(+86.3)#617 |
| 14. | Sedley | 100.0% | 10.5%(+89.5)#14 | 13.7%(+86.3)#621 |
| 15. | Mappsville | 100.0% | 10.5%(+89.5)#15 | 13.7%(+86.3)#760 |
| 16. | Cleveland | 100.0% | 10.5%(+89.5)#16 | 13.7%(+86.3)#835 |
| 17. | Stony Creek | 100.0% | 10.5%(+89.5)#17 | 13.7%(+86.3)#837 |
| 18. | Baskerville | 100.0% | 10.5%(+89.5)#18 | 13.7%(+86.3)#971 |
| 19. | Stevens Creek | 100.0% | 10.5%(+89.5)#19 | 13.7%(+86.3)#1,118 |
| 20. | Pantops | 92.3% | 10.5%(+81.9)#20 | 13.7%(+78.6)#1,219 |
| 21. | Meadowview | 85.2% | 10.5%(+74.7)#21 | 13.7%(+71.5)#1,288 |
| 22. | Kings Park | 85.1% | 10.5%(+74.7)#22 | 13.7%(+71.4)#1,289 |
| 23. | Rustburg | 82.3% | 10.5%(+71.8)#23 | 13.7%(+68.6)#1,335 |
| 24. | Fair Lakes | 74.4% | 10.5%(+63.9)#24 | 13.7%(+60.6)#1,496 |
| 25. | Norton | 70.4% | 10.5%(+59.9)#25 | 13.7%(+56.7)#1,603 |
| 26. | Berryville | 70.3% | 10.5%(+59.8)#26 | 13.7%(+56.6)#1,604 |
| 27. | Bedford | 68.1% | 10.5%(+57.6)#27 | 13.7%(+54.3)#1,653 |
| 28. | Greenbriar | 67.9% | 10.5%(+57.4)#28 | 13.7%(+54.2)#1,659 |
| 29. | Rio | 66.7% | 10.5%(+56.2)#29 | 13.7%(+53.0)#1,699 |
| 30. | Nokesville | 63.4% | 10.5%(+53.0)#30 | 13.7%(+49.7)#1,823 |
| 31. | Shenandoah | 60.0% | 10.5%(+49.5)#31 | 13.7%(+46.3)#1,920 |
| 32. | Altavista | 59.2% | 10.5%(+48.7)#32 | 13.7%(+45.4)#1,979 |
| 33. | Victoria | 59.1% | 10.5%(+48.6)#33 | 13.7%(+45.4)#1,981 |
| 34. | Hurt | 57.1% | 10.5%(+46.7)#34 | 13.7%(+43.4)#2,048 |
| 35. | Smithfield | 52.9% | 10.5%(+42.5)#35 | 13.7%(+39.2)#2,239 |
| 36. | Stanley | 52.6% | 10.5%(+42.2)#36 | 13.7%(+38.9)#2,253 |
| 37. | Pennington Gap | 52.2% | 10.5%(+41.7)#37 | 13.7%(+38.5)#2,269 |
| 38. | Burkeville | 50.0% | 10.5%(+39.5)#38 | 13.7%(+36.3)#2,440 |
| 39. | Shenandoah Farms | 48.8% | 10.5%(+38.3)#39 | 13.7%(+35.1)#2,541 |
| 40. | Broadway | 48.6% | 10.5%(+38.2)#40 | 13.7%(+34.9)#2,545 |
| 41. | Spotsylvania Courthouse | 46.4% | 10.5%(+36.0)#41 | 13.7%(+32.7)#2,627 |
| 42. | Jonesville | 46.2% | 10.5%(+35.7)#42 | 13.7%(+32.4)#2,639 |
| 43. | Dumbarton | 41.7% | 10.5%(+31.2)#43 | 13.7%(+28.0)#2,872 |
| 44. | Bon Air | 41.5% | 10.5%(+31.0)#44 | 13.7%(+27.8)#2,885 |
| 45. | Bellwood | 38.9% | 10.5%(+28.4)#45 | 13.7%(+25.2)#3,061 |
| 46. | Martinsville | 38.8% | 10.5%(+28.3)#46 | 13.7%(+25.1)#3,073 |
| 47. | Brodnax | 38.0% | 10.5%(+27.5)#47 | 13.7%(+24.3)#3,115 |
| 48. | Cape Charles | 37.5% | 10.5%(+27.0)#48 | 13.7%(+23.8)#3,144 |
| 49. | Keller | 37.5% | 10.5%(+27.0)#49 | 13.7%(+23.8)#3,156 |
| 50. | Lakeside | 36.4% | 10.5%(+25.9)#50 | 13.7%(+22.7)#3,221 |
| 51. | Mount Jackson | 35.7% | 10.5%(+25.3)#51 | 13.7%(+22.0)#3,282 |
| 52. | South Boston | 33.3% | 10.5%(+22.9)#52 | 13.7%(+19.6)#3,434 |
| 53. | Iron Gate | 33.3% | 10.5%(+22.9)#53 | 13.7%(+19.6)#3,532 |
| 54. | Alberta | 33.3% | 10.5%(+22.9)#54 | 13.7%(+19.6)#3,543 |
| 55. | Hopewell | 32.9% | 10.5%(+22.5)#55 | 13.7%(+19.2)#3,576 |
| 56. | Highland Springs | 30.9% | 10.5%(+20.4)#56 | 13.7%(+17.2)#3,712 |
| 57. | South Hill | 29.7% | 10.5%(+19.3)#57 | 13.7%(+16.0)#3,831 |
| 58. | Hutchison | 29.3% | 10.5%(+18.9)#58 | 13.7%(+15.6)#3,859 |
| 59. | Franconia | 27.8% | 10.5%(+17.4)#59 | 13.7%(+14.1)#3,988 |
| 60. | Radford | 26.0% | 10.5%(+15.5)#60 | 13.7%(+12.3)#4,156 |
| 61. | Wakefield | 25.9% | 10.5%(+15.5)#61 | 13.7%(+12.2)#4,160 |
| 62. | Clarksville | 25.0% | 10.5%(+14.5)#62 | 13.7%(+11.3)#4,249 |
| 63. | Scottsville | 25.0% | 10.5%(+14.5)#63 | 13.7%(+11.3)#4,271 |
| 64. | Lorton | 24.4% | 10.5%(+13.9)#64 | 13.7%(+10.7)#4,327 |
| 65. | Salem | 23.7% | 10.5%(+13.2)#65 | 13.7%(+9.95)#4,387 |
| 66. | Rural Retreat | 23.1% | 10.5%(+12.6)#66 | 13.7%(+9.36)#4,452 |
| 67. | Clintwood | 23.1% | 10.5%(+12.6)#67 | 13.7%(+9.36)#4,454 |
| 68. | Wytheville | 23.0% | 10.5%(+12.5)#68 | 13.7%(+9.24)#4,471 |
| 69. | Laurel | 22.1% | 10.5%(+11.7)#69 | 13.7%(+8.39)#4,569 |
| 70. | Danville | 21.5% | 10.5%(+11.0)#70 | 13.7%(+7.77)#4,635 |
| 71. | Dunn Loring | 20.8% | 10.5%(+10.4)#71 | 13.7%(+7.12)#4,711 |
| 72. | Woodlawn Cdp Fairfax County | 20.8% | 10.5%(+10.4)#72 | 13.7%(+7.09)#4,720 |
| 73. | Chesapeake | 20.7% | 10.5%(+10.3)#73 | 13.7%(+7.01)#4,732 |
| 74. | Manchester | 19.8% | 10.5%(+9.33)#74 | 13.7%(+6.07)#4,880 |
| 75. | Lynchburg | 19.6% | 10.5%(+9.11)#75 | 13.7%(+5.85)#4,902 |
| 76. | Fairfax | 19.6% | 10.5%(+9.11)#76 | 13.7%(+5.85)#4,903 |
| 77. | Sterling | 18.9% | 10.5%(+8.47)#77 | 13.7%(+5.21)#4,988 |
| 78. | Annandale | 18.6% | 10.5%(+8.15)#78 | 13.7%(+4.89)#5,033 |
| 79. | Springfield | 18.2% | 10.5%(+7.78)#79 | 13.7%(+4.52)#5,072 |
| 80. | Rocky Mount | 18.1% | 10.5%(+7.62)#80 | 13.7%(+4.36)#5,112 |
| 81. | Roanoke | 18.0% | 10.5%(+7.53)#81 | 13.7%(+4.27)#5,120 |
| 82. | Manassas Park | 17.4% | 10.5%(+7.00)#82 | 13.7%(+3.74)#5,181 |
| 83. | New Castle | 16.7% | 10.5%(+6.22)#83 | 13.7%(+2.95)#5,323 |
| 84. | Hybla Valley | 16.4% | 10.5%(+5.98)#84 | 13.7%(+2.72)#5,352 |
| 85. | University Of Virginia | 16.1% | 10.5%(+5.68)#85 | 13.7%(+2.42)#5,386 |
| 86. | Norfolk | 16.1% | 10.5%(+5.65)#86 | 13.7%(+2.39)#5,390 |
| 87. | East Highland Park | 15.4% | 10.5%(+4.91)#87 | 13.7%(+1.64)#5,499 |
| 88. | Portsmouth | 15.3% | 10.5%(+4.84)#88 | 13.7%(+1.57)#5,508 |
| 89. | Oakton | 14.7% | 10.5%(+4.21)#89 | 13.7%(+0.950)#5,581 |
| 90. | Bluefield | 14.3% | 10.5%(+3.83)#90 | 13.7%(+0.573)#5,634 |
| 91. | Arlington | 14.0% | 10.5%(+3.53)#91 | 13.7%(+0.269)#5,695 |
| 92. | Bensley | 13.3% | 10.5%(+2.88)#92 | 13.7%(-0.379)#5,796 |
| 93. | Midlothian | 13.3% | 10.5%(+2.83)#93 | 13.7%(-0.431)#5,815 |
| 94. | Franklin Farm | 12.7% | 10.5%(+2.23)#94 | 13.7%(-1.04)#5,896 |
| 95. | Leesburg | 12.6% | 10.5%(+2.15)#95 | 13.7%(-1.11)#5,907 |
| 96. | Remington | 12.5% | 10.5%(+2.05)#96 | 13.7%(-1.21)#5,939 |
| 97. | Bristol | 12.1% | 10.5%(+1.70)#97 | 13.7%(-1.56)#5,998 |
| 98. | Lincolnia | 11.6% | 10.5%(+1.14)#98 | 13.7%(-2.12)#6,077 |
| 99. | Richmond | 11.6% | 10.5%(+1.10)#99 | 13.7%(-2.16)#6,081 |
| 100. | Windsor | 11.5% | 10.5%(+1.09)#100 | 13.7%(-2.17)#6,084 |
Common Questions
What are the Top 10 Cities with the Highest Poverty Level Among Single Fathers in Virginia?
Top 10 Cities with the Highest Poverty Level Among Single Fathers in Virginia are:
#1
100.0%
#2
100.0%
#3
100.0%
#4
100.0%
#5
100.0%
#6
100.0%
#7
100.0%
#8
100.0%
#9
100.0%
#10
100.0%
What city has the Highest Poverty Level Among Single Fathers in Virginia?
Lake of the Woods has the Highest Poverty Level Among Single Fathers in Virginia with 100.0%.
What is the Poverty Level Among Single Fathers in the State of Virginia?
Poverty Level Among Single Fathers in Virginia is 10.5%.
What is the Poverty Level Among Single Fathers in the United States?
Poverty Level Among Single Fathers in the United States is 13.7%.