Cities with the Highest Poverty Level Among Single Fathers in Pennsylvania
RELATED REPORTS & OPTIONS
Highest Poverty | Single Father
Pennsylvania
Compare Cities
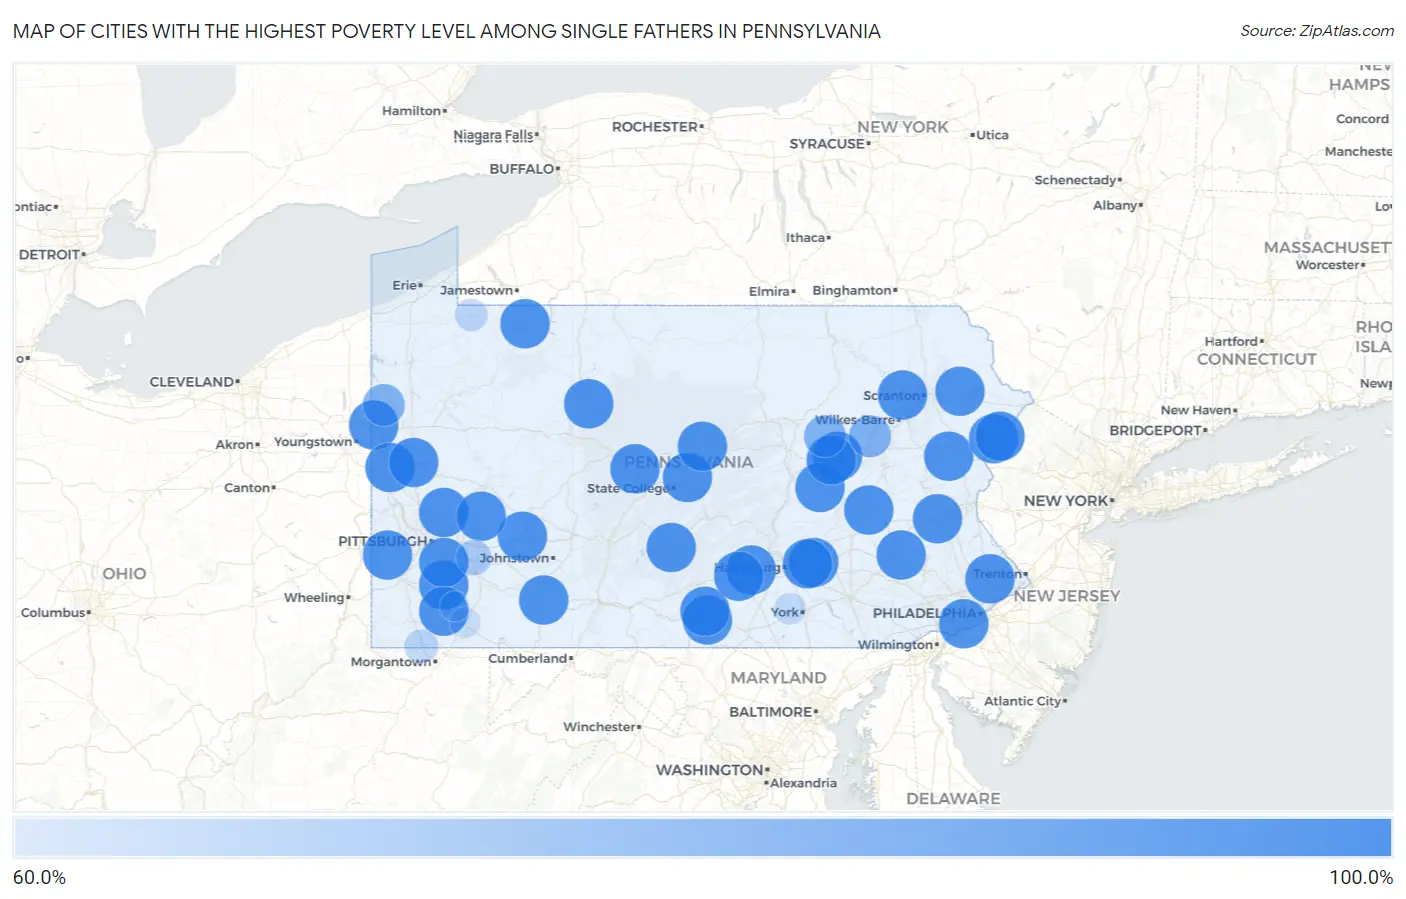
Map of Cities with the Highest Poverty Level Among Single Fathers in Pennsylvania
0.0%
100.0%
Cities with the Highest Poverty Level Among Single Fathers in Pennsylvania
| City | Single Father Poverty | vs State | vs National | |
| 1. | Emmaus Borough | 100.0% | 14.3%(+85.7)#1 | 13.7%(+86.3)#9 |
| 2. | White Oak Borough | 100.0% | 14.3%(+85.7)#2 | 13.7%(+86.3)#32 |
| 3. | Monessen | 100.0% | 14.3%(+85.7)#3 | 13.7%(+86.3)#42 |
| 4. | Clairton | 100.0% | 14.3%(+85.7)#4 | 13.7%(+86.3)#50 |
| 5. | Sierra View | 100.0% | 14.3%(+85.7)#5 | 13.7%(+86.3)#56 |
| 6. | Punxsutawney Borough | 100.0% | 14.3%(+85.7)#6 | 13.7%(+86.3)#58 |
| 7. | Schlusser | 100.0% | 14.3%(+85.7)#7 | 13.7%(+86.3)#59 |
| 8. | West Hazleton Borough | 100.0% | 14.3%(+85.7)#8 | 13.7%(+86.3)#73 |
| 9. | Slatington Borough | 100.0% | 14.3%(+85.7)#9 | 13.7%(+86.3)#103 |
| 10. | Farrell | 100.0% | 14.3%(+85.7)#10 | 13.7%(+86.3)#104 |
| 11. | Saw Creek | 100.0% | 14.3%(+85.7)#11 | 13.7%(+86.3)#107 |
| 12. | Warminster Heights | 100.0% | 14.3%(+85.7)#12 | 13.7%(+86.3)#114 |
| 13. | Pleasant Gap | 100.0% | 14.3%(+85.7)#13 | 13.7%(+86.3)#129 |
| 14. | Pine Ridge | 100.0% | 14.3%(+85.7)#14 | 13.7%(+86.3)#169 |
| 15. | Fayetteville | 100.0% | 14.3%(+85.7)#15 | 13.7%(+86.3)#190 |
| 16. | Ashley Borough | 100.0% | 14.3%(+85.7)#16 | 13.7%(+86.3)#210 |
| 17. | Cetronia | 100.0% | 14.3%(+85.7)#17 | 13.7%(+86.3)#224 |
| 18. | The Hideout | 100.0% | 14.3%(+85.7)#18 | 13.7%(+86.3)#254 |
| 19. | North Warren | 100.0% | 14.3%(+85.7)#19 | 13.7%(+86.3)#278 |
| 20. | East Pittsburgh Borough | 100.0% | 14.3%(+85.7)#20 | 13.7%(+86.3)#281 |
| 21. | Fairchance Borough | 100.0% | 14.3%(+85.7)#21 | 13.7%(+86.3)#316 |
| 22. | North Belle Vernon Borough | 100.0% | 14.3%(+85.7)#22 | 13.7%(+86.3)#332 |
| 23. | Espy | 100.0% | 14.3%(+85.7)#23 | 13.7%(+86.3)#336 |
| 24. | Millbourne Borough | 100.0% | 14.3%(+85.7)#24 | 13.7%(+86.3)#357 |
| 25. | Republic | 100.0% | 14.3%(+85.7)#25 | 13.7%(+86.3)#381 |
| 26. | Palmdale | 100.0% | 14.3%(+85.7)#26 | 13.7%(+86.3)#390 |
| 27. | Westfield Borough | 100.0% | 14.3%(+85.7)#27 | 13.7%(+86.3)#401 |
| 28. | Apollo Borough | 100.0% | 14.3%(+85.7)#28 | 13.7%(+86.3)#405 |
| 29. | Friedens | 100.0% | 14.3%(+85.7)#29 | 13.7%(+86.3)#423 |
| 30. | Scotland | 100.0% | 14.3%(+85.7)#30 | 13.7%(+86.3)#428 |
| 31. | Hastings Borough | 100.0% | 14.3%(+85.7)#31 | 13.7%(+86.3)#461 |
| 32. | Black Lick | 100.0% | 14.3%(+85.7)#32 | 13.7%(+86.3)#479 |
| 33. | Upper Exeter | 100.0% | 14.3%(+85.7)#33 | 13.7%(+86.3)#496 |
| 34. | Briar Creek Borough | 100.0% | 14.3%(+85.7)#34 | 13.7%(+86.3)#509 |
| 35. | Stony Creek Mills | 100.0% | 14.3%(+85.7)#35 | 13.7%(+86.3)#531 |
| 36. | West Pittsburg | 100.0% | 14.3%(+85.7)#36 | 13.7%(+86.3)#539 |
| 37. | Bendersville Borough | 100.0% | 14.3%(+85.7)#37 | 13.7%(+86.3)#609 |
| 38. | Kersey | 100.0% | 14.3%(+85.7)#38 | 13.7%(+86.3)#634 |
| 39. | Bairdford | 100.0% | 14.3%(+85.7)#39 | 13.7%(+86.3)#637 |
| 40. | Connoquenessing Borough | 100.0% | 14.3%(+85.7)#40 | 13.7%(+86.3)#641 |
| 41. | Thompsontown Borough | 100.0% | 14.3%(+85.7)#41 | 13.7%(+86.3)#654 |
| 42. | Hawk Run | 100.0% | 14.3%(+85.7)#42 | 13.7%(+86.3)#691 |
| 43. | Atlasburg | 100.0% | 14.3%(+85.7)#43 | 13.7%(+86.3)#696 |
| 44. | Renningers | 100.0% | 14.3%(+85.7)#44 | 13.7%(+86.3)#698 |
| 45. | Blanchard | 100.0% | 14.3%(+85.7)#45 | 13.7%(+86.3)#721 |
| 46. | Winterstown Borough | 100.0% | 14.3%(+85.7)#46 | 13.7%(+86.3)#722 |
| 47. | Lake Arthur Estates | 100.0% | 14.3%(+85.7)#47 | 13.7%(+86.3)#743 |
| 48. | Marianna Borough | 100.0% | 14.3%(+85.7)#48 | 13.7%(+86.3)#750 |
| 49. | Wattsburg Borough | 100.0% | 14.3%(+85.7)#49 | 13.7%(+86.3)#754 |
| 50. | Beallsville Borough | 100.0% | 14.3%(+85.7)#50 | 13.7%(+86.3)#761 |
| 51. | Union Deposit | 100.0% | 14.3%(+85.7)#51 | 13.7%(+86.3)#763 |
| 52. | Eldred Borough | 100.0% | 14.3%(+85.7)#52 | 13.7%(+86.3)#784 |
| 53. | Prospect Park | 100.0% | 14.3%(+85.7)#53 | 13.7%(+86.3)#793 |
| 54. | Smithton Borough | 100.0% | 14.3%(+85.7)#54 | 13.7%(+86.3)#794 |
| 55. | Wilmore Borough | 100.0% | 14.3%(+85.7)#55 | 13.7%(+86.3)#806 |
| 56. | Mapleton Borough | 100.0% | 14.3%(+85.7)#56 | 13.7%(+86.3)#828 |
| 57. | Herndon Borough | 100.0% | 14.3%(+85.7)#57 | 13.7%(+86.3)#830 |
| 58. | North Vandergrift | 100.0% | 14.3%(+85.7)#58 | 13.7%(+86.3)#845 |
| 59. | Hop Bottom Borough | 100.0% | 14.3%(+85.7)#59 | 13.7%(+86.3)#888 |
| 60. | Hartleton Borough | 100.0% | 14.3%(+85.7)#60 | 13.7%(+86.3)#911 |
| 61. | Tharptown Uniontown | 100.0% | 14.3%(+85.7)#61 | 13.7%(+86.3)#920 |
| 62. | Stockdale Borough | 100.0% | 14.3%(+85.7)#62 | 13.7%(+86.3)#945 |
| 63. | Mckee | 100.0% | 14.3%(+85.7)#63 | 13.7%(+86.3)#949 |
| 64. | Plainfield | 100.0% | 14.3%(+85.7)#64 | 13.7%(+86.3)#957 |
| 65. | Rupert | 100.0% | 14.3%(+85.7)#65 | 13.7%(+86.3)#986 |
| 66. | Mount Gretna Borough | 100.0% | 14.3%(+85.7)#66 | 13.7%(+86.3)#1,016 |
| 67. | Tylersville | 100.0% | 14.3%(+85.7)#67 | 13.7%(+86.3)#1,033 |
| 68. | Eastvale Borough | 100.0% | 14.3%(+85.7)#68 | 13.7%(+86.3)#1,038 |
| 69. | Jackson Center Borough | 100.0% | 14.3%(+85.7)#69 | 13.7%(+86.3)#1,041 |
| 70. | Charlottsville | 100.0% | 14.3%(+85.7)#70 | 13.7%(+86.3)#1,055 |
| 71. | Callensburg Borough | 100.0% | 14.3%(+85.7)#71 | 13.7%(+86.3)#1,059 |
| 72. | Cedar Crest | 100.0% | 14.3%(+85.7)#72 | 13.7%(+86.3)#1,158 |
| 73. | Glasgow Borough | 100.0% | 14.3%(+85.7)#73 | 13.7%(+86.3)#1,162 |
| 74. | St. Clair | 100.0% | 14.3%(+85.7)#74 | 13.7%(+86.3)#1,175 |
| 75. | Beavertown | 100.0% | 14.3%(+85.7)#75 | 13.7%(+86.3)#1,197 |
| 76. | Paint Borough | 93.8% | 14.3%(+79.4)#76 | 13.7%(+80.0)#1,214 |
| 77. | Prospect Park Borough | 88.1% | 14.3%(+73.8)#77 | 13.7%(+74.4)#1,250 |
| 78. | Reynolds Heights | 87.5% | 14.3%(+73.2)#78 | 13.7%(+73.8)#1,253 |
| 79. | Mocanaqua | 87.5% | 14.3%(+73.2)#79 | 13.7%(+73.8)#1,258 |
| 80. | Iola | 87.5% | 14.3%(+73.2)#80 | 13.7%(+73.8)#1,263 |
| 81. | Delta Borough | 85.7% | 14.3%(+71.4)#81 | 13.7%(+72.0)#1,278 |
| 82. | Forty Fort Borough | 81.6% | 14.3%(+67.3)#82 | 13.7%(+67.9)#1,349 |
| 83. | Philipsburg Borough | 78.9% | 14.3%(+64.5)#83 | 13.7%(+65.2)#1,404 |
| 84. | Hummelstown Borough | 77.8% | 14.3%(+63.4)#84 | 13.7%(+64.1)#1,420 |
| 85. | Jeannette | 76.4% | 14.3%(+62.1)#85 | 13.7%(+62.7)#1,438 |
| 86. | Mount Morris | 73.7% | 14.3%(+59.3)#86 | 13.7%(+60.0)#1,505 |
| 87. | Smethport Borough | 73.4% | 14.3%(+59.1)#87 | 13.7%(+59.7)#1,509 |
| 88. | Rouseville Borough | 73.3% | 14.3%(+59.0)#88 | 13.7%(+59.6)#1,520 |
| 89. | Strasburg Borough | 73.0% | 14.3%(+58.6)#89 | 13.7%(+59.3)#1,526 |
| 90. | Tarentum Borough | 72.6% | 14.3%(+58.3)#90 | 13.7%(+58.9)#1,541 |
| 91. | Tunkhannock Borough | 72.2% | 14.3%(+57.9)#91 | 13.7%(+58.5)#1,548 |
| 92. | Corry | 72.1% | 14.3%(+57.8)#92 | 13.7%(+58.4)#1,551 |
| 93. | Strattanville Borough | 71.4% | 14.3%(+57.1)#93 | 13.7%(+57.7)#1,571 |
| 94. | Shillington Borough | 70.8% | 14.3%(+56.4)#94 | 13.7%(+57.0)#1,589 |
| 95. | Weigelstown | 70.6% | 14.3%(+56.2)#95 | 13.7%(+56.8)#1,595 |
| 96. | Weissport Borough | 70.0% | 14.3%(+55.7)#96 | 13.7%(+56.3)#1,615 |
| 97. | East Uniontown | 69.2% | 14.3%(+54.9)#97 | 13.7%(+55.5)#1,625 |
| 98. | Coraopolis Borough | 69.1% | 14.3%(+54.8)#98 | 13.7%(+55.4)#1,631 |
| 99. | Charleroi Borough | 68.8% | 14.3%(+54.4)#99 | 13.7%(+55.0)#1,634 |
| 100. | Smock | 68.1% | 14.3%(+53.7)#100 | 13.7%(+54.4)#1,652 |
Common Questions
What are the Top 10 Cities with the Highest Poverty Level Among Single Fathers in Pennsylvania?
Top 10 Cities with the Highest Poverty Level Among Single Fathers in Pennsylvania are:
#1
100.0%
#2
100.0%
#3
100.0%
#4
100.0%
#5
100.0%
#6
100.0%
#7
100.0%
#8
100.0%
#9
100.0%
#10
100.0%
What city has the Highest Poverty Level Among Single Fathers in Pennsylvania?
Monessen has the Highest Poverty Level Among Single Fathers in Pennsylvania with 100.0%.
What is the Poverty Level Among Single Fathers in the State of Pennsylvania?
Poverty Level Among Single Fathers in Pennsylvania is 14.3%.
What is the Poverty Level Among Single Fathers in the United States?
Poverty Level Among Single Fathers in the United States is 13.7%.