Cities with the Highest Poverty Level Among Single Fathers in the United States
RELATED REPORTS & OPTIONS
Highest Poverty | Single Father
United States
Compare Cities
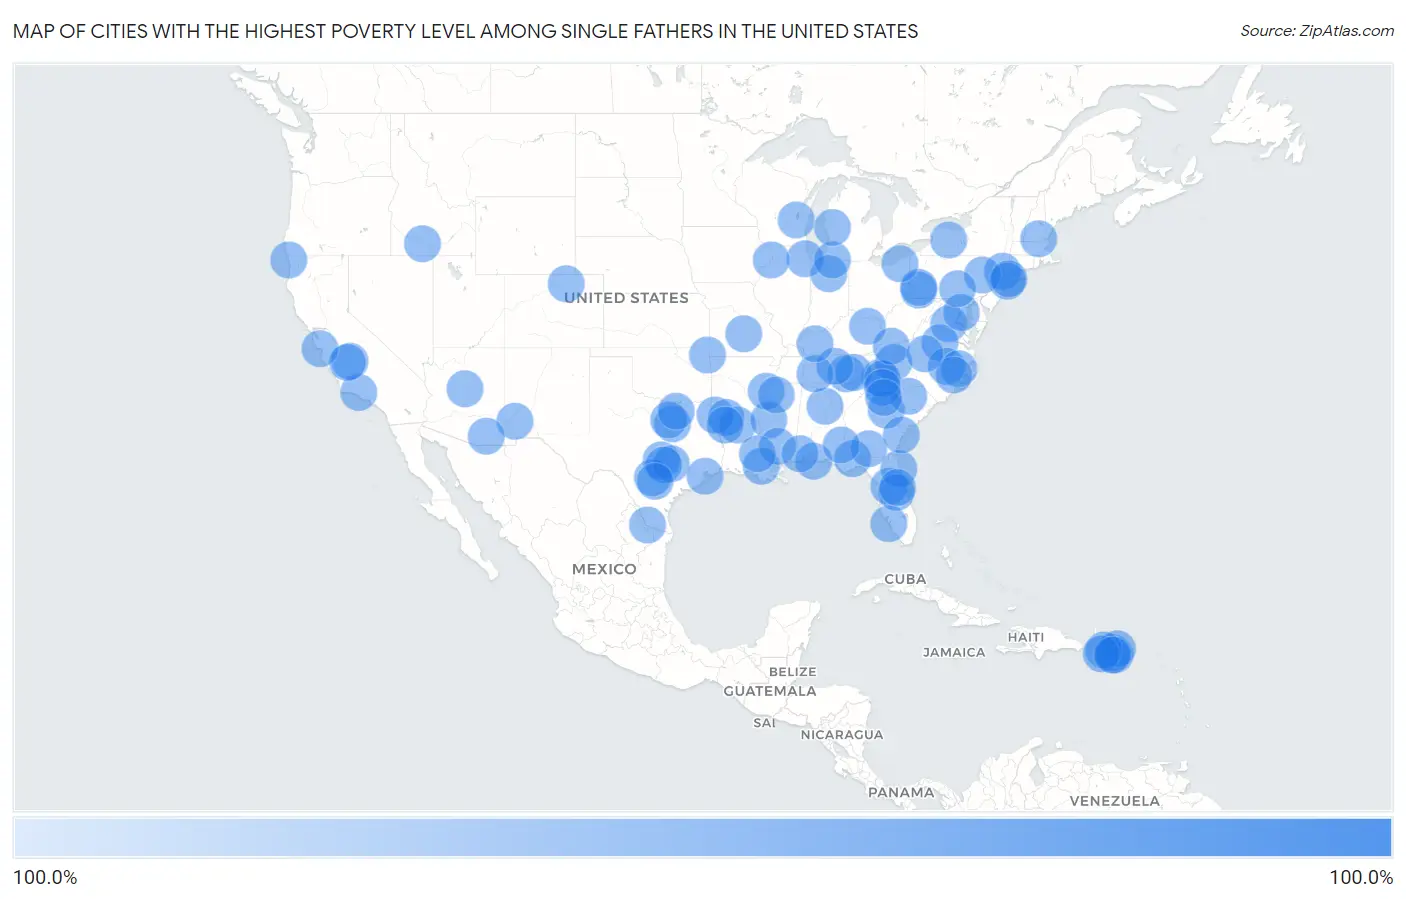
Map of Cities with the Highest Poverty Level Among Single Fathers in the United States
0.0%
100.0%
Cities with the Highest Poverty Level Among Single Fathers in the United States
| City | Single Father Poverty | vs State | vs National | |
| 1. | Ruston | 100.0% | 20.6%(+79.4)#1 | 13.7%(+86.3)#1 |
| 2. | Boone | 100.0% | 16.3%(+83.7)#1 | 13.7%(+86.3)#2 |
| 3. | Warrington | 100.0% | 13.8%(+86.2)#1 | 13.7%(+86.3)#3 |
| 4. | Grovetown | 100.0% | 15.3%(+84.7)#1 | 13.7%(+86.3)#4 |
| 5. | Wildwood | 100.0% | 13.8%(+86.2)#2 | 13.7%(+86.3)#5 |
| 6. | St Augustine | 100.0% | 13.8%(+86.2)#3 | 13.7%(+86.3)#6 |
| 7. | Iona | 100.0% | 13.8%(+86.2)#4 | 13.7%(+86.3)#7 |
| 8. | Doctor Phillips | 100.0% | 13.8%(+86.2)#5 | 13.7%(+86.3)#8 |
| 9. | Emmaus Borough | 100.0% | 14.3%(+85.7)#1 | 13.7%(+86.3)#9 |
| 10. | Roma | 100.0% | 13.4%(+86.6)#1 | 13.7%(+86.3)#10 |
| 11. | Manati | 100.0% | 56.3%(+43.7)#1 | 13.7%(+86.3)#11 |
| 12. | West Haverstraw | 100.0% | 15.3%(+84.7)#1 | 13.7%(+86.3)#12 |
| 13. | Yazoo City | 100.0% | 23.7%(+76.3)#1 | 13.7%(+86.3)#13 |
| 14. | San German | 100.0% | 56.3%(+43.7)#2 | 13.7%(+86.3)#14 |
| 15. | East Rockaway | 100.0% | 15.3%(+84.7)#2 | 13.7%(+86.3)#15 |
| 16. | Loudonville | 100.0% | 15.3%(+84.7)#3 | 13.7%(+86.3)#16 |
| 17. | Silver City | 100.0% | 20.4%(+79.6)#1 | 13.7%(+86.3)#17 |
| 18. | Helena West Helena | 100.0% | 19.8%(+80.2)#1 | 13.7%(+86.3)#18 |
| 19. | Chatham Borough | 100.0% | 11.7%(+88.3)#1 | 13.7%(+86.3)#19 |
| 20. | Lago Vista | 100.0% | 13.4%(+86.6)#2 | 13.7%(+86.3)#20 |
| 21. | Aibonito | 100.0% | 56.3%(+43.7)#3 | 13.7%(+86.3)#21 |
| 22. | Kennedale | 100.0% | 13.4%(+86.6)#3 | 13.7%(+86.3)#22 |
| 23. | Lake Of The Woods | 100.0% | 10.5%(+89.5)#1 | 13.7%(+86.3)#23 |
| 24. | Kenilworth Borough | 100.0% | 11.7%(+88.3)#2 | 13.7%(+86.3)#24 |
| 25. | Hillside | 100.0% | 13.4%(+86.6)#1 | 13.7%(+86.3)#25 |
| 26. | Camden | 100.0% | 17.5%(+82.5)#1 | 13.7%(+86.3)#26 |
| 27. | Arroyo | 100.0% | 56.3%(+43.7)#4 | 13.7%(+86.3)#27 |
| 28. | Quincy | 100.0% | 13.8%(+86.2)#6 | 13.7%(+86.3)#28 |
| 29. | Geneseo | 100.0% | 15.3%(+84.7)#4 | 13.7%(+86.3)#29 |
| 30. | Etowah | 100.0% | 16.3%(+83.7)#2 | 13.7%(+86.3)#30 |
| 31. | Farmville | 100.0% | 10.5%(+89.5)#2 | 13.7%(+86.3)#31 |
| 32. | White Oak Borough | 100.0% | 14.3%(+85.7)#2 | 13.7%(+86.3)#32 |
| 33. | Batesville | 100.0% | 23.7%(+76.3)#2 | 13.7%(+86.3)#33 |
| 34. | San Isidro | 100.0% | 56.3%(+43.7)#5 | 13.7%(+86.3)#34 |
| 35. | Pinon Hills | 100.0% | 12.0%(+88.0)#1 | 13.7%(+86.3)#35 |
| 36. | Dayton | 100.0% | 15.6%(+84.4)#1 | 13.7%(+86.3)#36 |
| 37. | Heathrow | 100.0% | 13.8%(+86.2)#7 | 13.7%(+86.3)#37 |
| 38. | Lackland Afb | 100.0% | 13.4%(+86.6)#4 | 13.7%(+86.3)#38 |
| 39. | Grove | 100.0% | 17.2%(+82.8)#1 | 13.7%(+86.3)#39 |
| 40. | Morehead | 100.0% | 18.3%(+81.7)#1 | 13.7%(+86.3)#40 |
| 41. | Camp Swift | 100.0% | 13.4%(+86.6)#5 | 13.7%(+86.3)#41 |
| 42. | Monessen | 100.0% | 14.3%(+85.7)#3 | 13.7%(+86.3)#42 |
| 43. | Mira Monte | 100.0% | 12.0%(+88.0)#2 | 13.7%(+86.3)#43 |
| 44. | Donaldsonville | 100.0% | 20.6%(+79.4)#2 | 13.7%(+86.3)#44 |
| 45. | Lemoore Station | 100.0% | 12.0%(+88.0)#3 | 13.7%(+86.3)#45 |
| 46. | Crescent City | 100.0% | 12.0%(+88.0)#4 | 13.7%(+86.3)#46 |
| 47. | Sweetwater | 100.0% | 15.6%(+84.4)#2 | 13.7%(+86.3)#47 |
| 48. | Huron | 100.0% | 12.0%(+88.0)#5 | 13.7%(+86.3)#48 |
| 49. | Rochester | 100.0% | 14.0%(+86.0)#1 | 13.7%(+86.3)#49 |
| 50. | Clairton | 100.0% | 14.3%(+85.7)#4 | 13.7%(+86.3)#50 |
| 51. | Cheverly | 100.0% | 9.8%(+90.2)#1 | 13.7%(+86.3)#51 |
| 52. | Woodcliff Lake Borough | 100.0% | 11.7%(+88.3)#3 | 13.7%(+86.3)#52 |
| 53. | East Flat Rock | 100.0% | 16.3%(+83.7)#3 | 13.7%(+86.3)#53 |
| 54. | Pleasure Point | 100.0% | 12.0%(+88.0)#6 | 13.7%(+86.3)#54 |
| 55. | Columbia | 100.0% | 23.7%(+76.3)#3 | 13.7%(+86.3)#55 |
| 56. | Sierra View | 100.0% | 14.3%(+85.7)#5 | 13.7%(+86.3)#56 |
| 57. | Eaton | 100.0% | 10.0%(+90.0)#1 | 13.7%(+86.3)#57 |
| 58. | Punxsutawney Borough | 100.0% | 14.3%(+85.7)#6 | 13.7%(+86.3)#58 |
| 59. | Schlusser | 100.0% | 14.3%(+85.7)#7 | 13.7%(+86.3)#59 |
| 60. | San Leon | 100.0% | 13.4%(+86.6)#6 | 13.7%(+86.3)#60 |
| 61. | Nashville | 100.0% | 16.3%(+83.7)#4 | 13.7%(+86.3)#61 |
| 62. | Adel | 100.0% | 15.3%(+84.7)#2 | 13.7%(+86.3)#62 |
| 63. | Piedmont | 100.0% | 17.5%(+82.5)#2 | 13.7%(+86.3)#63 |
| 64. | Atlanta | 100.0% | 13.4%(+86.6)#7 | 13.7%(+86.3)#64 |
| 65. | Waynesville | 100.0% | 13.8%(+86.2)#1 | 13.7%(+86.3)#65 |
| 66. | North Fond Du Lac | 100.0% | 11.2%(+88.8)#1 | 13.7%(+86.3)#66 |
| 67. | Benson | 100.0% | 13.2%(+86.8)#1 | 13.7%(+86.3)#67 |
| 68. | Shady Hollow | 100.0% | 13.4%(+86.6)#8 | 13.7%(+86.3)#68 |
| 69. | Margaret | 100.0% | 17.8%(+82.2)#1 | 13.7%(+86.3)#69 |
| 70. | Richlands | 100.0% | 10.5%(+89.5)#3 | 13.7%(+86.3)#70 |
| 71. | Chardon | 100.0% | 14.6%(+85.4)#1 | 13.7%(+86.3)#71 |
| 72. | Williamston | 100.0% | 16.3%(+83.7)#5 | 13.7%(+86.3)#72 |
| 73. | West Hazleton Borough | 100.0% | 14.3%(+85.7)#8 | 13.7%(+86.3)#73 |
| 74. | Semmes | 100.0% | 17.8%(+82.2)#2 | 13.7%(+86.3)#74 |
| 75. | Sandy Oaks | 100.0% | 13.4%(+86.6)#9 | 13.7%(+86.3)#75 |
| 76. | Smithville | 100.0% | 15.6%(+84.4)#3 | 13.7%(+86.3)#76 |
| 77. | Headland | 100.0% | 17.8%(+82.2)#3 | 13.7%(+86.3)#77 |
| 78. | Ayden | 100.0% | 16.3%(+83.7)#6 | 13.7%(+86.3)#78 |
| 79. | Abbeville | 100.0% | 17.5%(+82.5)#3 | 13.7%(+86.3)#79 |
| 80. | Lares | 100.0% | 56.3%(+43.7)#6 | 13.7%(+86.3)#80 |
| 81. | Harrington Park Borough | 100.0% | 11.7%(+88.3)#4 | 13.7%(+86.3)#81 |
| 82. | Mount Pleasant | 100.0% | 15.6%(+84.4)#4 | 13.7%(+86.3)#82 |
| 83. | Springhill | 100.0% | 20.6%(+79.4)#3 | 13.7%(+86.3)#83 |
| 84. | Lake Worth | 100.0% | 13.4%(+86.6)#10 | 13.7%(+86.3)#84 |
| 85. | East Merrimack | 100.0% | 11.7%(+88.3)#1 | 13.7%(+86.3)#85 |
| 86. | Montgomery | 100.0% | 15.3%(+84.7)#3 | 13.7%(+86.3)#86 |
| 87. | Jackson | 100.0% | 20.6%(+79.4)#4 | 13.7%(+86.3)#87 |
| 88. | Buhl | 100.0% | 10.5%(+89.5)#1 | 13.7%(+86.3)#88 |
| 89. | Camanche | 100.0% | 12.2%(+87.8)#1 | 13.7%(+86.3)#89 |
| 90. | Simonton Lake | 100.0% | 14.0%(+86.0)#2 | 13.7%(+86.3)#90 |
| 91. | Lake Montezuma | 100.0% | 13.2%(+86.8)#2 | 13.7%(+86.3)#91 |
| 92. | Lajas | 100.0% | 56.3%(+43.7)#7 | 13.7%(+86.3)#92 |
| 93. | Fremont | 100.0% | 15.1%(+84.9)#1 | 13.7%(+86.3)#93 |
| 94. | Pilot Point | 100.0% | 13.4%(+86.6)#11 | 13.7%(+86.3)#94 |
| 95. | Greenville | 100.0% | 18.3%(+81.7)#2 | 13.7%(+86.3)#95 |
| 96. | Haughton | 100.0% | 20.6%(+79.4)#5 | 13.7%(+86.3)#96 |
| 97. | Mount Hermon | 100.0% | 10.5%(+89.5)#4 | 13.7%(+86.3)#97 |
| 98. | Old Westbury | 100.0% | 15.3%(+84.7)#5 | 13.7%(+86.3)#98 |
| 99. | Santa Barbara | 100.0% | 56.3%(+43.7)#8 | 13.7%(+86.3)#99 |
| 100. | Salinas | 100.0% | 56.3%(+43.7)#9 | 13.7%(+86.3)#100 |
Common Questions
What are the Top 10 Cities with the Highest Poverty Level Among Single Fathers in the United States?
Top 10 Cities with the Highest Poverty Level Among Single Fathers in the United States are:
#1
100.0%
#2
100.0%
#3
100.0%
#4
100.0%
#5
100.0%
#6
100.0%
#7
100.0%
#8
100.0%
#9
100.0%
#10
100.0%
What city has the Highest Poverty Level Among Single Fathers in the United States?
Ruston has the Highest Poverty Level Among Single Fathers in the United States with 100.0%.
What is the Poverty Level Among Single Fathers in the United States?
Poverty Level Among Single Fathers in the United States is 13.7%.