Cities with the Highest Percentage of Immigrants from Kenya in Illinois
RELATED REPORTS & OPTIONS
Kenya
Illinois
Compare Cities
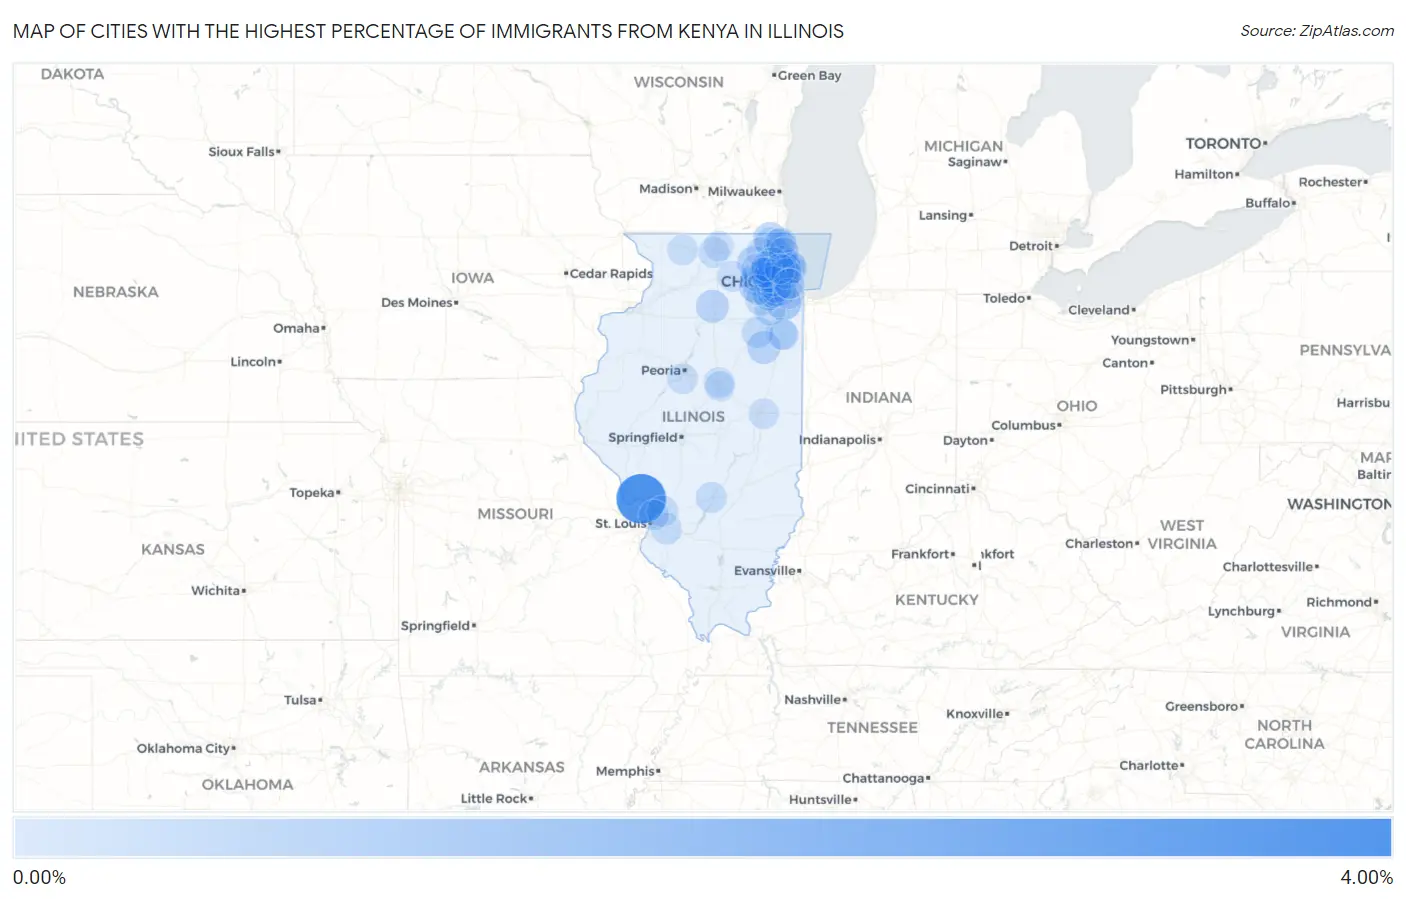
Map of Cities with the Highest Percentage of Immigrants from Kenya in Illinois
0.00%
4.00%
Cities with the Highest Percentage of Immigrants from Kenya in Illinois
| City | Kenya | vs State | vs National | |
| 1. | Elsah | 3.02% | 0.018%(+3.00)#13 | 0.048%(+2.97)#527 |
| 2. | Orland Hills | 0.80% | 0.018%(+0.785)#86 | 0.048%(+0.756)#2,423 |
| 3. | Lake Villa | 0.47% | 0.018%(+0.453)#151 | 0.048%(+0.423)#3,553 |
| 4. | Gilberts | 0.44% | 0.018%(+0.422)#158 | 0.048%(+0.392)#3,688 |
| 5. | Mendota | 0.42% | 0.018%(+0.398)#168 | 0.048%(+0.369)#3,806 |
| 6. | Burr Ridge | 0.41% | 0.018%(+0.395)#169 | 0.048%(+0.365)#3,807 |
| 7. | Cabery | 0.41% | 0.018%(+0.395)#171 | 0.048%(+0.365)#3,828 |
| 8. | Oak Brook | 0.41% | 0.018%(+0.391)#172 | 0.048%(+0.361)#3,829 |
| 9. | North Aurora | 0.29% | 0.018%(+0.274)#206 | 0.048%(+0.245)#4,524 |
| 10. | Bourbonnais | 0.20% | 0.018%(+0.186)#207 | 0.048%(+0.156)#4,525 |
| 11. | Gardner | 0.20% | 0.018%(+0.185)#231 | 0.048%(+0.155)#5,244 |
| 12. | Geneva | 0.20% | 0.018%(+0.178)#232 | 0.048%(+0.148)#5,245 |
| 13. | Plainfield | 0.19% | 0.018%(+0.175)#233 | 0.048%(+0.146)#5,246 |
| 14. | Preston Heights | 0.19% | 0.018%(+0.175)#234 | 0.048%(+0.145)#5,247 |
| 15. | North Chicago | 0.19% | 0.018%(+0.173)#235 | 0.048%(+0.143)#5,248 |
| 16. | Shiloh | 0.17% | 0.018%(+0.154)#236 | 0.048%(+0.125)#5,249 |
| 17. | Edwardsville | 0.16% | 0.018%(+0.143)#237 | 0.048%(+0.114)#5,250 |
| 18. | Vandalia | 0.15% | 0.018%(+0.130)#255 | 0.048%(+0.101)#5,706 |
| 19. | Vernon Hills | 0.15% | 0.018%(+0.127)#256 | 0.048%(+0.098)#5,707 |
| 20. | Bolingbrook | 0.14% | 0.018%(+0.118)#257 | 0.048%(+0.089)#5,708 |
| 21. | Naperville | 0.12% | 0.018%(+0.104)#258 | 0.048%(+0.074)#5,709 |
| 22. | Glenview | 0.12% | 0.018%(+0.103)#259 | 0.048%(+0.073)#5,710 |
| 23. | Rockford | 0.092% | 0.018%(+0.074)#260 | 0.048%(+0.045)#5,711 |
| 24. | Niles | 0.088% | 0.018%(+0.070)#261 | 0.048%(+0.040)#5,712 |
| 25. | Northbrook | 0.074% | 0.018%(+0.056)#262 | 0.048%(+0.026)#5,713 |
| 26. | Freeport | 0.071% | 0.018%(+0.053)#270 | 0.048%(+0.023)#6,095 |
| 27. | Wilmette | 0.068% | 0.018%(+0.050)#272 | 0.048%(+0.020)#6,124 |
| 28. | Woodridge | 0.068% | 0.018%(+0.049)#273 | 0.048%(+0.020)#6,125 |
| 29. | Dekalb | 0.066% | 0.018%(+0.048)#274 | 0.048%(+0.018)#6,126 |
| 30. | Morton Grove | 0.064% | 0.018%(+0.046)#275 | 0.048%(+0.016)#6,127 |
| 31. | Normal | 0.060% | 0.018%(+0.042)#276 | 0.048%(+0.013)#6,128 |
| 32. | Wheaton | 0.060% | 0.018%(+0.041)#277 | 0.048%(+0.012)#6,129 |
| 33. | Pekin | 0.059% | 0.018%(+0.041)#288 | 0.048%(+0.011)#6,445 |
| 34. | Bloomingdale | 0.058% | 0.018%(+0.039)#289 | 0.048%(+0.010)#6,446 |
| 35. | Roselle | 0.057% | 0.018%(+0.038)#290 | 0.048%(+0.009)#6,447 |
| 36. | Darien | 0.055% | 0.018%(+0.036)#291 | 0.048%(+0.007)#6,448 |
| 37. | Streamwood | 0.053% | 0.018%(+0.035)#292 | 0.048%(+0.005)#6,449 |
| 38. | Skokie | 0.052% | 0.018%(+0.034)#293 | 0.048%(+0.004)#6,450 |
| 39. | St Charles | 0.052% | 0.018%(+0.033)#294 | 0.048%(+0.004)#6,501 |
| 40. | Schaumburg | 0.052% | 0.018%(+0.033)#295 | 0.048%(+0.004)#6,502 |
| 41. | Round Lake Beach | 0.051% | 0.018%(+0.033)#296 | 0.048%(+0.004)#6,503 |
| 42. | Westmont | 0.045% | 0.018%(+0.027)#297 | 0.048%(-0.003)#6,504 |
| 43. | Urbana | 0.041% | 0.018%(+0.023)#298 | 0.048%(-0.007)#6,505 |
| 44. | Oakwood Hills | 0.040% | 0.018%(+0.022)#299 | 0.048%(-0.007)#6,506 |
| 45. | Carol Stream | 0.035% | 0.018%(+0.017)#300 | 0.048%(-0.013)#6,507 |
| 46. | Gurnee | 0.033% | 0.018%(+0.014)#301 | 0.048%(-0.015)#6,508 |
| 47. | Waukegan | 0.032% | 0.018%(+0.014)#302 | 0.048%(-0.015)#6,509 |
| 48. | Palatine | 0.028% | 0.018%(+0.010)#303 | 0.048%(-0.020)#6,510 |
| 49. | Park Ridge | 0.028% | 0.018%(+0.009)#304 | 0.048%(-0.020)#6,511 |
| 50. | Granite City | 0.026% | 0.018%(+0.007)#305 | 0.048%(-0.022)#6,512 |
| 51. | Lombard | 0.025% | 0.018%(+0.006)#306 | 0.048%(-0.023)#6,513 |
| 52. | Hanover Park | 0.024% | 0.018%(+0.006)#307 | 0.048%(-0.024)#6,514 |
| 53. | Glendale Heights | 0.021% | 0.018%(+0.003)#308 | 0.048%(-0.027)#6,515 |
| 54. | Chicago | 0.019% | 0.018%(+0.001)#309 | 0.048%(-0.029)#6,516 |
| 55. | Elgin | 0.018% | 0.018%(-0.001)#310 | 0.048%(-0.030)#6,517 |
| 56. | Evanston | 0.017% | 0.018%(-0.002)#311 | 0.048%(-0.031)#6,518 |
| 57. | Aurora | 0.015% | 0.018%(-0.003)#312 | 0.048%(-0.032)#6,519 |
| 58. | Bartlett | 0.012% | 0.018%(-0.006)#313 | 0.048%(-0.036)#6,520 |
| 59. | Harwood Heights | 0.011% | 0.018%(-0.007)#314 | 0.048%(-0.037)#6,521 |
| 60. | Hoffman Estates | 0.0077% | 0.018%(-0.011)#315 | 0.048%(-0.040)#6,522 |
| 61. | Bradley | 0.0065% | 0.018%(-0.012)#316 | 0.048%(-0.041)#6,523 |
| 62. | Lake Forest | 0.0051% | 0.018%(-0.013)#317 | 0.048%(-0.043)#6,524 |
| 63. | Loves Park | 0.0044% | 0.018%(-0.014)#318 | 0.048%(-0.044)#6,525 |
| 64. | Oak Lawn | 0.0017% | 0.018%(-0.017)#319 | 0.048%(-0.046)#6,526 |
| 65. | Des Plaines | 0.0017% | 0.018%(-0.017)#320 | 0.048%(-0.046)#6,527 |
| 66. | Bloomington | 0.0013% | 0.018%(-0.017)#321 | 0.048%(-0.047)#6,528 |
| 67. | Cicero | 0.0012% | 0.018%(-0.017)#322 | 0.048%(-0.047)#6,529 |
Common Questions
What are the Top 10 Cities with the Highest Percentage of Immigrants from Kenya in Illinois?
Top 10 Cities with the Highest Percentage of Immigrants from Kenya in Illinois are:
#1
3.02%
#2
0.80%
#3
0.47%
#4
0.44%
#5
0.42%
#6
0.41%
#7
0.41%
#8
0.41%
#9
0.29%
#10
0.20%
What city has the Highest Percentage of Immigrants from Kenya in Illinois?
Elsah has the Highest Percentage of Immigrants from Kenya in Illinois with 3.02%.
What is the Percentage of Immigrants from Kenya in the State of Illinois?
Percentage of Immigrants from Kenya in Illinois is 0.018%.
What is the Percentage of Immigrants from Kenya in the United States?
Percentage of Immigrants from Kenya in the United States is 0.048%.