Cities with the Highest Percentage of Immigrants from Colombia in the United States
RELATED REPORTS & OPTIONS
Colombia
United States
Compare Cities
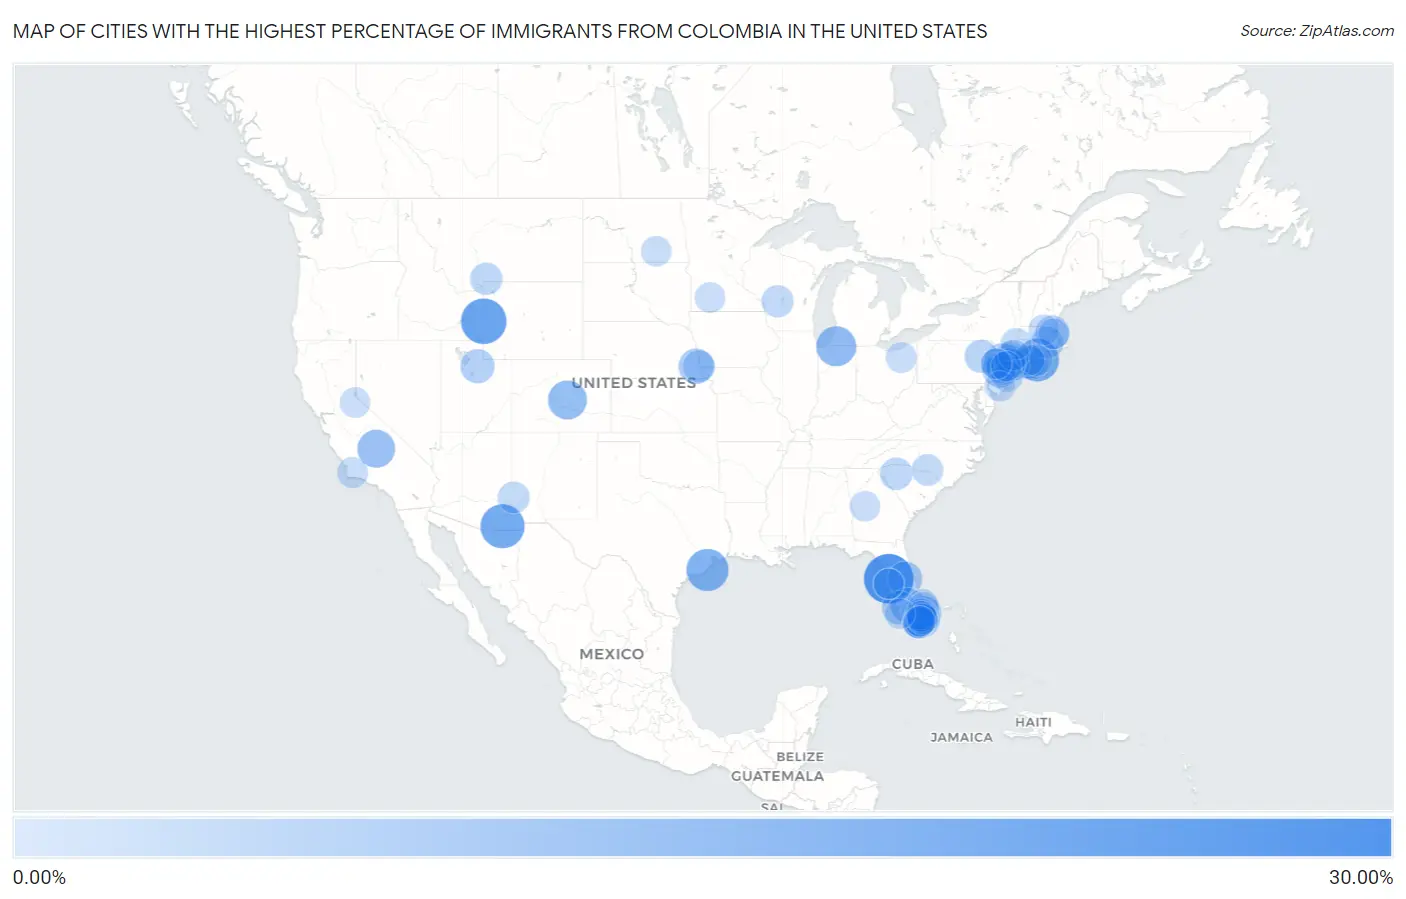
Map of Cities with the Highest Percentage of Immigrants from Colombia in the United States
0.00%
30.00%
Cities with the Highest Percentage of Immigrants from Colombia in the United States
| City | Colombia | vs State | vs National | |
| 1. | Quail Ridge | 29.74% | 1.38%(+28.4)#-1 | 0.26%(+29.5)#0 |
| 2. | Victory Gardens Borough | 26.29% | 0.98%(+25.3)#3 | 0.26%(+26.0)#40 |
| 3. | Freedom | 24.19% | 0.049%(+24.1)#-1 | 0.26%(+23.9)#41 |
| 4. | Cornwall | 24.10% | 0.50%(+23.6)#-1 | 0.26%(+23.8)#42 |
| 5. | Mcneal | 22.22% | 0.084%(+22.1)#-1 | 0.26%(+22.0)#43 |
| 6. | Napeague | 20.78% | 0.56%(+20.2)#-1 | 0.26%(+20.5)#44 |
| 7. | Quintana | 19.51% | 0.21%(+19.3)#-1 | 0.26%(+19.3)#45 |
| 8. | Moonachie Borough | 17.88% | 0.98%(+16.9)#77 | 0.26%(+17.6)#1,180 |
| 9. | Indian Village | 16.54% | 0.046%(+16.5)#-1 | 0.26%(+16.3)#1,181 |
| 10. | Midland | 15.29% | 0.10%(+15.2)#-1 | 0.26%(+15.0)#1,182 |
| 11. | Ponderosa | 13.79% | 0.14%(+13.7)#-1 | 0.26%(+13.5)#1,183 |
| 12. | Wharton Borough | 12.78% | 0.98%(+11.8)#78 | 0.26%(+12.5)#1,184 |
| 13. | Dover | 11.11% | 0.98%(+10.1)#79 | 0.26%(+10.9)#1,185 |
| 14. | North Bay Village | 10.67% | 1.38%(+9.29)#103 | 0.26%(+10.4)#1,186 |
| 15. | Dunellen Borough | 10.58% | 0.98%(+9.60)#80 | 0.26%(+10.3)#1,187 |
| 16. | Ojus | 10.54% | 1.38%(+9.16)#104 | 0.26%(+10.3)#1,188 |
| 17. | Dunbar | 10.45% | 0.082%(+10.4)#-1 | 0.26%(+10.2)#1,189 |
| 18. | Lauderdale By The Sea | 10.34% | 1.38%(+8.95)#105 | 0.26%(+10.1)#1,190 |
| 19. | Skillman | 10.10% | 0.98%(+9.12)#81 | 0.26%(+9.84)#1,191 |
| 20. | Doral | 10.04% | 1.38%(+8.66)#166 | 0.26%(+9.78)#1,234 |
| 21. | Country Club | 9.78% | 1.38%(+8.39)#167 | 0.26%(+9.52)#1,235 |
| 22. | Hampton Bays | 9.62% | 0.56%(+9.06)#29 | 0.26%(+9.36)#1,236 |
| 23. | Sunny Isles Beach | 9.58% | 1.38%(+8.20)#213 | 0.26%(+9.32)#1,775 |
| 24. | Fairfield | 9.50% | 0.17%(+9.33)#-1 | 0.26%(+9.24)#1,776 |
| 25. | Meadow Woods | 9.42% | 1.38%(+8.04)#272 | 0.26%(+9.16)#2,498 |
| 26. | Hamburg Borough | 9.41% | 0.98%(+8.43)#82 | 0.26%(+9.15)#2,499 |
| 27. | Pioneer | 9.31% | 1.38%(+7.93)#273 | 0.26%(+9.05)#2,500 |
| 28. | Aventura | 9.24% | 1.38%(+7.86)#274 | 0.26%(+8.98)#2,501 |
| 29. | Weston | 9.02% | 1.38%(+7.64)#275 | 0.26%(+8.76)#2,502 |
| 30. | Hideout | 8.82% | 0.17%(+8.65)#-1 | 0.26%(+8.56)#2,503 |
| 31. | Revere | 8.34% | 0.40%(+7.94)#2 | 0.26%(+8.08)#2,504 |
| 32. | Page Park | 8.29% | 1.38%(+6.91)#276 | 0.26%(+8.03)#2,505 |
| 33. | Virginia Gardens | 8.23% | 1.38%(+6.85)#277 | 0.26%(+7.97)#2,506 |
| 34. | Elizabeth | 7.71% | 0.98%(+6.73)#83 | 0.26%(+7.45)#2,507 |
| 35. | Fountainebleau | 7.56% | 1.38%(+6.18)#278 | 0.26%(+7.30)#2,508 |
| 36. | Center Point | 7.43% | 0.21%(+7.22)#0 | 0.26%(+7.17)#2,509 |
| 37. | Key Biscayne | 7.33% | 1.38%(+5.95)#279 | 0.26%(+7.07)#2,510 |
| 38. | Sheatown | 7.31% | 0.11%(+7.20)#-1 | 0.26%(+7.05)#2,511 |
| 39. | Harrison | 6.96% | 0.98%(+5.98)#84 | 0.26%(+6.70)#2,512 |
| 40. | Enoree | 6.58% | 0.22%(+6.35)#-1 | 0.26%(+6.32)#2,513 |
| 41. | Kendall West | 6.57% | 1.38%(+5.19)#280 | 0.26%(+6.31)#2,514 |
| 42. | Corwin Springs | 6.45% | 0.023%(+6.43)#-1 | 0.26%(+6.19)#2,515 |
| 43. | Central Falls | 6.38% | 0.60%(+5.78)#-1 | 0.26%(+6.12)#2,516 |
| 44. | East Millstone | 6.28% | 0.98%(+5.30)#85 | 0.26%(+6.02)#2,517 |
| 45. | Sunrise | 6.17% | 1.38%(+4.79)#281 | 0.26%(+5.91)#2,518 |
| 46. | Quiogue | 6.10% | 0.56%(+5.54)#30 | 0.26%(+5.84)#2,519 |
| 47. | Nebraska City | 6.09% | 0.082%(+6.01)#4 | 0.26%(+5.83)#2,520 |
| 48. | Wyeville | 6.03% | 0.052%(+5.98)#-1 | 0.26%(+5.77)#2,521 |
| 49. | East Hampton North | 6.03% | 0.56%(+5.47)#31 | 0.26%(+5.77)#2,522 |
| 50. | The Crossings | 6.02% | 1.38%(+4.64)#282 | 0.26%(+5.76)#2,523 |
| 51. | Englewood | 5.91% | 0.98%(+4.92)#112 | 0.26%(+5.65)#2,524 |
| 52. | The Hammocks | 5.88% | 1.38%(+4.49)#283 | 0.26%(+5.62)#2,525 |
| 53. | Lodi Borough | 5.86% | 0.98%(+4.88)#113 | 0.26%(+5.60)#2,526 |
| 54. | Three Lakes | 5.79% | 1.38%(+4.41)#284 | 0.26%(+5.53)#2,527 |
| 55. | Schall Circle | 5.76% | 1.38%(+4.38)#285 | 0.26%(+5.50)#2,528 |
| 56. | Pleasanton | 5.65% | 0.060%(+5.59)#-1 | 0.26%(+5.39)#2,529 |
| 57. | Kendale Lakes | 5.36% | 1.38%(+3.98)#286 | 0.26%(+5.10)#2,530 |
| 58. | Bellerose Terrace | 5.34% | 0.56%(+4.78)#32 | 0.26%(+5.08)#2,531 |
| 59. | East Rockingham | 5.32% | 0.17%(+5.14)#-1 | 0.26%(+5.06)#2,532 |
| 60. | West Nyack | 5.28% | 0.56%(+4.72)#33 | 0.26%(+5.02)#2,533 |
| 61. | Country Walk | 5.25% | 1.38%(+3.87)#287 | 0.26%(+4.99)#2,534 |
| 62. | Pembroke Pines | 5.24% | 1.38%(+3.86)#288 | 0.26%(+4.98)#2,535 |
| 63. | Bay Harbor Islands | 5.19% | 1.38%(+3.81)#289 | 0.26%(+4.93)#2,536 |
| 64. | Riverhead | 5.15% | 0.56%(+4.59)#96 | 0.26%(+4.89)#2,537 |
| 65. | West New York | 5.14% | 0.98%(+4.15)#114 | 0.26%(+4.88)#2,538 |
| 66. | Shillington Borough | 5.09% | 0.11%(+4.99)#15 | 0.26%(+4.83)#2,539 |
| 67. | Hollywood | 5.08% | 1.38%(+3.70)#290 | 0.26%(+4.82)#2,540 |
| 68. | Amenia | 5.05% | 0.56%(+4.49)#97 | 0.26%(+4.79)#2,541 |
| 69. | Finderne | 5.05% | 0.98%(+4.07)#115 | 0.26%(+4.79)#2,542 |
| 70. | Catawissa Borough | 4.97% | 0.11%(+4.87)#16 | 0.26%(+4.71)#2,543 |
| 71. | Richmond West | 4.70% | 1.38%(+3.32)#291 | 0.26%(+4.44)#2,544 |
| 72. | Ramtown | 4.69% | 0.98%(+3.71)#116 | 0.26%(+4.43)#2,545 |
| 73. | Bedford Hills | 4.69% | 0.56%(+4.13)#98 | 0.26%(+4.43)#2,546 |
| 74. | Anderson | 4.67% | 0.98%(+3.69)#117 | 0.26%(+4.41)#2,547 |
| 75. | North Plainfield Borough | 4.67% | 0.98%(+3.68)#118 | 0.26%(+4.41)#2,548 |
| 76. | North Miami Beach | 4.62% | 1.38%(+3.24)#292 | 0.26%(+4.36)#2,549 |
| 77. | Pigeon Creek | 4.56% | 0.039%(+4.52)#-1 | 0.26%(+4.30)#2,550 |
| 78. | Miami Beach | 4.54% | 1.38%(+3.16)#293 | 0.26%(+4.28)#2,551 |
| 79. | Shirley | 4.49% | 0.40%(+4.09)#3 | 0.26%(+4.23)#2,552 |
| 80. | Los Alamos | 4.44% | 0.14%(+4.30)#0 | 0.26%(+4.18)#2,553 |
| 81. | Winthrop Town | 4.42% | 0.40%(+4.03)#4 | 0.26%(+4.16)#2,554 |
| 82. | Seminole Manor | 4.35% | 1.38%(+2.97)#294 | 0.26%(+4.09)#2,555 |
| 83. | Tamarac | 4.31% | 1.38%(+2.93)#295 | 0.26%(+4.05)#2,556 |
| 84. | West Miami | 4.29% | 1.38%(+2.91)#296 | 0.26%(+4.03)#2,557 |
| 85. | Jud | 4.26% | 0.030%(+4.23)#-1 | 0.26%(+4.00)#2,558 |
| 86. | Oxford | 4.24% | 0.98%(+3.26)#119 | 0.26%(+3.98)#2,559 |
| 87. | Bridgewater | 4.23% | 0.50%(+3.72)#0 | 0.26%(+3.97)#2,560 |
| 88. | Bergenfield Borough | 4.19% | 0.98%(+3.21)#120 | 0.26%(+3.93)#2,561 |
| 89. | Davie | 4.16% | 1.38%(+2.78)#297 | 0.26%(+3.90)#2,562 |
| 90. | El Portal | 4.10% | 1.38%(+2.72)#298 | 0.26%(+3.84)#2,563 |
| 91. | Glenvar Heights | 4.05% | 1.38%(+2.67)#299 | 0.26%(+3.79)#2,564 |
| 92. | Carrollwood | 4.04% | 1.38%(+2.66)#309 | 0.26%(+3.78)#3,007 |
| 93. | Elwood | 4.03% | 0.98%(+3.04)#121 | 0.26%(+3.77)#3,008 |
| 94. | Kirkwood | 4.02% | 0.14%(+3.88)#1 | 0.26%(+3.76)#3,009 |
| 95. | Bogota Borough | 4.00% | 0.98%(+3.02)#122 | 0.26%(+3.74)#3,010 |
| 96. | Sanborn | 4.00% | 0.064%(+3.94)#-1 | 0.26%(+3.74)#3,011 |
| 97. | Linden | 3.98% | 0.98%(+3.00)#123 | 0.26%(+3.72)#3,012 |
| 98. | Golden Gate | 3.98% | 1.38%(+2.60)#310 | 0.26%(+3.72)#3,013 |
| 99. | Salem | 3.98% | 0.22%(+3.76)#-1 | 0.26%(+3.72)#3,014 |
| 100. | Northdale | 3.96% | 1.38%(+2.58)#311 | 0.26%(+3.70)#3,015 |
Common Questions
What are the Top 10 Cities with the Highest Percentage of Immigrants from Colombia in the United States?
Top 10 Cities with the Highest Percentage of Immigrants from Colombia in the United States are:
What city has the Highest Percentage of Immigrants from Colombia in the United States?
Quail Ridge has the Highest Percentage of Immigrants from Colombia in the United States with 29.74%.
What is the Percentage of Immigrants from Colombia in the United States?
Percentage of Immigrants from Colombia in the United States is 0.26%.