Cities with the Highest Percentage of Immigrants from Colombia in New York
RELATED REPORTS & OPTIONS
Colombia
New York
Compare Cities
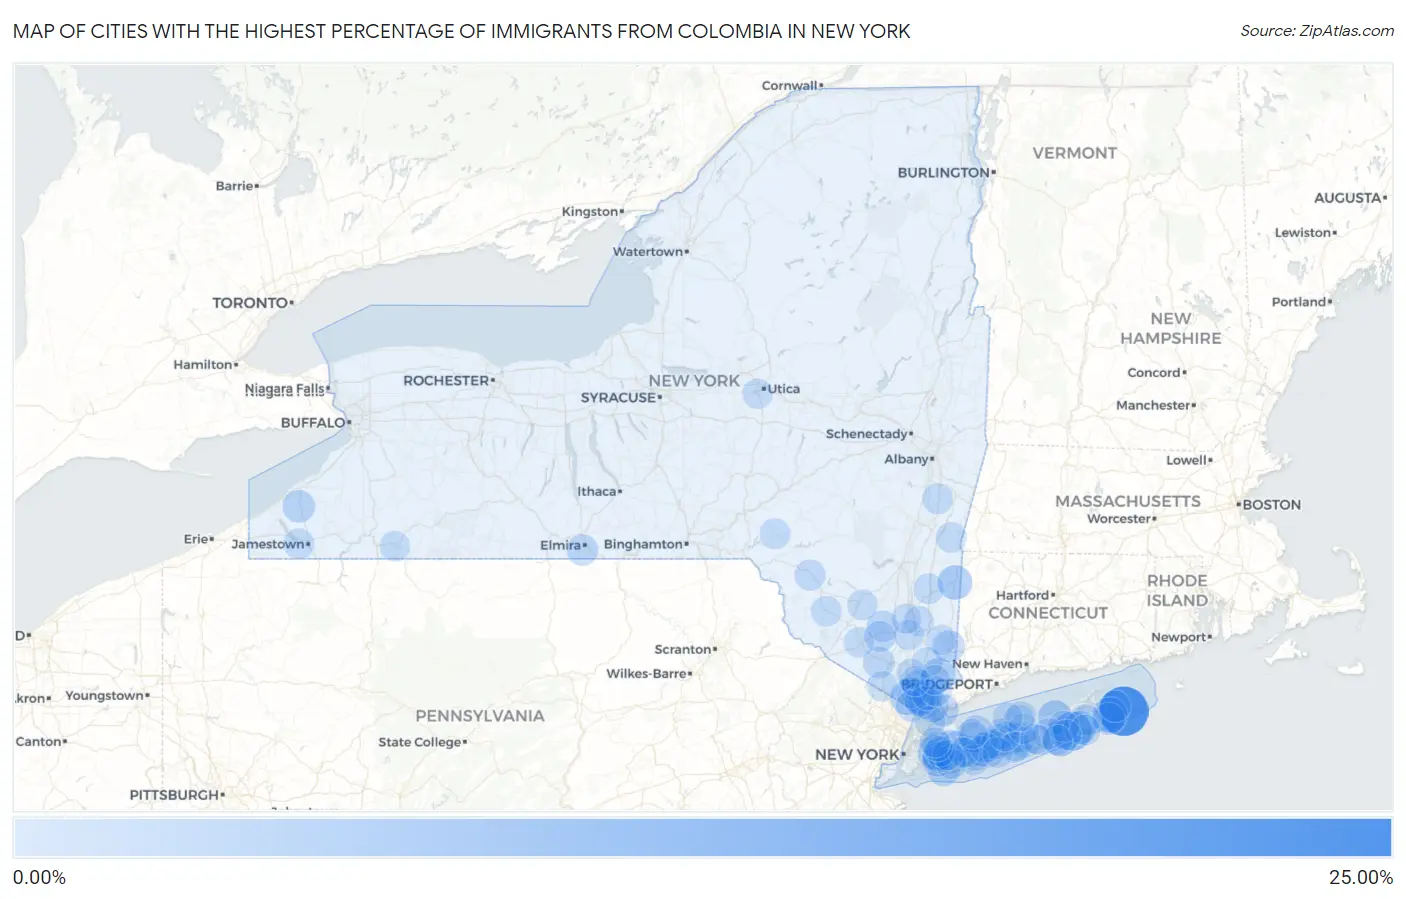
Map of Cities with the Highest Percentage of Immigrants from Colombia in New York
0.00%
25.00%
Cities with the Highest Percentage of Immigrants from Colombia in New York
| City | Colombia | vs State | vs National | |
| 1. | Napeague | 20.78% | 0.56%(+20.2)#-1 | 0.26%(+20.5)#0 |
| 2. | Hampton Bays | 9.62% | 0.56%(+9.06)#29 | 0.26%(+9.36)#423 |
| 3. | Quiogue | 6.10% | 0.56%(+5.54)#30 | 0.26%(+5.84)#424 |
| 4. | East Hampton North | 6.03% | 0.56%(+5.47)#31 | 0.26%(+5.77)#425 |
| 5. | Bellerose Terrace | 5.34% | 0.56%(+4.78)#32 | 0.26%(+5.08)#426 |
| 6. | West Nyack | 5.28% | 0.56%(+4.72)#33 | 0.26%(+5.02)#427 |
| 7. | Riverhead | 5.15% | 0.56%(+4.59)#96 | 0.26%(+4.89)#1,357 |
| 8. | Amenia | 5.05% | 0.56%(+4.49)#97 | 0.26%(+4.79)#1,358 |
| 9. | Bedford Hills | 4.69% | 0.56%(+4.13)#98 | 0.26%(+4.43)#1,359 |
| 10. | Shinnecock Hills | 3.84% | 0.56%(+3.28)#99 | 0.26%(+3.58)#1,360 |
| 11. | Sleepy Hollow | 3.72% | 0.56%(+3.16)#110 | 0.26%(+3.46)#1,531 |
| 12. | Ossining | 3.36% | 0.56%(+2.80)#111 | 0.26%(+3.10)#1,532 |
| 13. | Elmsford | 3.27% | 0.56%(+2.71)#112 | 0.26%(+3.01)#1,533 |
| 14. | Westbury | 3.23% | 0.56%(+2.67)#121 | 0.26%(+2.97)#1,751 |
| 15. | South Floral Park | 3.22% | 0.56%(+2.66)#122 | 0.26%(+2.96)#1,752 |
| 16. | Island Park | 3.17% | 0.56%(+2.61)#123 | 0.26%(+2.91)#1,753 |
| 17. | Cassadaga | 3.09% | 0.56%(+2.53)#124 | 0.26%(+2.83)#1,754 |
| 18. | Port Chester | 3.05% | 0.56%(+2.49)#128 | 0.26%(+2.79)#1,886 |
| 19. | White Plains | 3.05% | 0.56%(+2.49)#173 | 0.26%(+2.79)#2,771 |
| 20. | Greenlawn | 2.89% | 0.56%(+2.33)#174 | 0.26%(+2.63)#2,772 |
| 21. | Brewster Hill | 2.88% | 0.56%(+2.32)#175 | 0.26%(+2.62)#2,773 |
| 22. | Bay Shore | 2.86% | 0.56%(+2.30)#176 | 0.26%(+2.60)#2,774 |
| 23. | East Hampton | 2.83% | 0.56%(+2.27)#177 | 0.26%(+2.57)#2,775 |
| 24. | Islandia | 2.83% | 0.56%(+2.27)#178 | 0.26%(+2.57)#2,776 |
| 25. | East Farmingdale | 2.25% | 0.56%(+1.69)#179 | 0.26%(+1.99)#2,777 |
| 26. | Springs | 2.23% | 0.56%(+1.67)#180 | 0.26%(+1.97)#2,778 |
| 27. | North Lindenhurst | 2.21% | 0.56%(+1.65)#181 | 0.26%(+1.95)#2,779 |
| 28. | Walden | 2.13% | 0.56%(+1.57)#182 | 0.26%(+1.87)#2,780 |
| 29. | Southport | 2.06% | 0.56%(+1.50)#183 | 0.26%(+1.80)#2,781 |
| 30. | Eastport | 2.01% | 0.56%(+1.45)#184 | 0.26%(+1.75)#2,782 |
| 31. | Hicksville | 1.98% | 0.56%(+1.43)#185 | 0.26%(+1.72)#2,783 |
| 32. | Walton Park | 1.98% | 0.56%(+1.42)#186 | 0.26%(+1.72)#2,784 |
| 33. | Elmont | 1.96% | 0.56%(+1.40)#187 | 0.26%(+1.70)#2,785 |
| 34. | Maybrook | 1.95% | 0.56%(+1.39)#188 | 0.26%(+1.69)#2,786 |
| 35. | North Bay Shore | 1.94% | 0.56%(+1.38)#189 | 0.26%(+1.68)#2,787 |
| 36. | Tuxedo | 1.92% | 0.56%(+1.36)#190 | 0.26%(+1.66)#2,788 |
| 37. | North Sea | 1.87% | 0.56%(+1.31)#191 | 0.26%(+1.61)#2,789 |
| 38. | Flanders | 1.78% | 0.56%(+1.22)#192 | 0.26%(+1.52)#2,790 |
| 39. | Medford | 1.77% | 0.56%(+1.21)#193 | 0.26%(+1.51)#2,791 |
| 40. | Valley Stream | 1.70% | 0.56%(+1.14)#194 | 0.26%(+1.44)#2,792 |
| 41. | Cadyville | 1.64% | 0.56%(+1.08)#195 | 0.26%(+1.38)#2,793 |
| 42. | Holtsville | 1.63% | 0.56%(+1.07)#196 | 0.26%(+1.37)#2,794 |
| 43. | Livingston Manor | 1.62% | 0.56%(+1.06)#197 | 0.26%(+1.36)#2,795 |
| 44. | Valley Cottage | 1.62% | 0.56%(+1.06)#198 | 0.26%(+1.36)#2,796 |
| 45. | Sparkill | 1.60% | 0.56%(+1.04)#199 | 0.26%(+1.34)#2,797 |
| 46. | Walton | 1.53% | 0.56%(+0.970)#200 | 0.26%(+1.27)#2,798 |
| 47. | Levittown | 1.49% | 0.56%(+0.932)#201 | 0.26%(+1.23)#2,799 |
| 48. | Brentwood | 1.44% | 0.56%(+0.879)#202 | 0.26%(+1.18)#2,800 |
| 49. | North Bellport | 1.42% | 0.56%(+0.865)#203 | 0.26%(+1.16)#2,801 |
| 50. | West Hempstead | 1.42% | 0.56%(+0.857)#204 | 0.26%(+1.16)#2,802 |
| 51. | Kinderhook | 1.41% | 0.56%(+0.847)#205 | 0.26%(+1.15)#2,803 |
| 52. | Southampton | 1.38% | 0.56%(+0.824)#206 | 0.26%(+1.12)#2,804 |
| 53. | Lakewood | 1.37% | 0.56%(+0.813)#207 | 0.26%(+1.11)#2,805 |
| 54. | Nesconset | 1.37% | 0.56%(+0.806)#208 | 0.26%(+1.11)#2,806 |
| 55. | North Valley Stream | 1.36% | 0.56%(+0.802)#209 | 0.26%(+1.10)#2,807 |
| 56. | Monticello | 1.36% | 0.56%(+0.797)#210 | 0.26%(+1.10)#2,808 |
| 57. | South Huntington | 1.34% | 0.56%(+0.779)#211 | 0.26%(+1.08)#2,809 |
| 58. | New Rochelle | 1.34% | 0.56%(+0.776)#212 | 0.26%(+1.08)#2,810 |
| 59. | Jefferson Valley Yorktown | 1.31% | 0.56%(+0.748)#213 | 0.26%(+1.05)#2,811 |
| 60. | Salt Point | 1.31% | 0.56%(+0.747)#214 | 0.26%(+1.05)#2,812 |
| 61. | Ellenville | 1.28% | 0.56%(+0.722)#215 | 0.26%(+1.02)#2,813 |
| 62. | Tarrytown | 1.27% | 0.56%(+0.714)#216 | 0.26%(+1.01)#2,814 |
| 63. | Roosevelt | 1.24% | 0.56%(+0.678)#217 | 0.26%(+0.977)#2,815 |
| 64. | North Babylon | 1.23% | 0.56%(+0.674)#218 | 0.26%(+0.974)#2,816 |
| 65. | Copake Lake | 1.22% | 0.56%(+0.664)#219 | 0.26%(+0.964)#2,817 |
| 66. | Miller Place | 1.22% | 0.56%(+0.664)#220 | 0.26%(+0.964)#2,818 |
| 67. | Central Islip | 1.22% | 0.56%(+0.662)#221 | 0.26%(+0.961)#2,819 |
| 68. | Sloatsburg | 1.22% | 0.56%(+0.658)#222 | 0.26%(+0.958)#2,820 |
| 69. | Hawthorne | 1.21% | 0.56%(+0.655)#223 | 0.26%(+0.955)#2,821 |
| 70. | Blue Point | 1.21% | 0.56%(+0.653)#224 | 0.26%(+0.953)#2,822 |
| 71. | Copiague | 1.21% | 0.56%(+0.652)#225 | 0.26%(+0.952)#2,823 |
| 72. | Freeport | 1.19% | 0.56%(+0.635)#226 | 0.26%(+0.934)#2,824 |
| 73. | Patchogue | 1.13% | 0.56%(+0.574)#227 | 0.26%(+0.874)#2,825 |
| 74. | East Quogue | 1.12% | 0.56%(+0.561)#228 | 0.26%(+0.861)#2,826 |
| 75. | Mechanicstown | 1.11% | 0.56%(+0.554)#229 | 0.26%(+0.854)#2,827 |
| 76. | Baywood | 1.10% | 0.56%(+0.540)#230 | 0.26%(+0.840)#2,828 |
| 77. | St Bonaventure | 1.10% | 0.56%(+0.539)#231 | 0.26%(+0.839)#2,829 |
| 78. | East Islip | 1.08% | 0.56%(+0.523)#232 | 0.26%(+0.823)#2,830 |
| 79. | Middle Island | 1.07% | 0.56%(+0.512)#233 | 0.26%(+0.812)#2,831 |
| 80. | Mastic | 1.07% | 0.56%(+0.509)#234 | 0.26%(+0.809)#2,832 |
| 81. | New Hartford | 1.06% | 0.56%(+0.498)#235 | 0.26%(+0.798)#2,833 |
| 82. | Myers Corner | 1.05% | 0.56%(+0.492)#236 | 0.26%(+0.791)#2,834 |
| 83. | Huntington Station | 1.01% | 0.56%(+0.449)#237 | 0.26%(+0.749)#2,835 |
| 84. | New Hyde Park | 1.01% | 0.56%(+0.447)#238 | 0.26%(+0.746)#2,836 |
| 85. | Armonk | 1.01% | 0.56%(+0.445)#239 | 0.26%(+0.745)#2,837 |
| 86. | Lake Ronkonkoma | 1.00% | 0.56%(+0.438)#240 | 0.26%(+0.738)#2,838 |
| 87. | Moriches | 0.99% | 0.56%(+0.430)#241 | 0.26%(+0.730)#2,839 |
| 88. | Hempstead | 0.99% | 0.56%(+0.426)#242 | 0.26%(+0.725)#2,840 |
| 89. | Montrose | 0.94% | 0.56%(+0.379)#243 | 0.26%(+0.679)#2,841 |
| 90. | Plainedge | 0.94% | 0.56%(+0.377)#244 | 0.26%(+0.677)#2,842 |
| 91. | Beacon | 0.93% | 0.56%(+0.370)#245 | 0.26%(+0.670)#2,843 |
| 92. | Lake Carmel | 0.93% | 0.56%(+0.367)#246 | 0.26%(+0.667)#2,844 |
| 93. | Lake Success | 0.92% | 0.56%(+0.361)#247 | 0.26%(+0.660)#2,845 |
| 94. | Sound Beach | 0.91% | 0.56%(+0.349)#248 | 0.26%(+0.649)#2,846 |
| 95. | Mount Kisco | 0.90% | 0.56%(+0.345)#249 | 0.26%(+0.644)#2,847 |
| 96. | Poquott | 0.90% | 0.56%(+0.344)#250 | 0.26%(+0.643)#2,848 |
| 97. | Great Neck Plaza | 0.90% | 0.56%(+0.340)#251 | 0.26%(+0.640)#2,849 |
| 98. | Westhampton Beach | 0.90% | 0.56%(+0.336)#252 | 0.26%(+0.636)#2,850 |
| 99. | Croton On Hudson | 0.89% | 0.56%(+0.326)#253 | 0.26%(+0.626)#2,851 |
| 100. | Marlboro | 0.88% | 0.56%(+0.321)#254 | 0.26%(+0.620)#2,852 |
Common Questions
What are the Top 10 Cities with the Highest Percentage of Immigrants from Colombia in New York?
Top 10 Cities with the Highest Percentage of Immigrants from Colombia in New York are:
#1
20.78%
#2
9.62%
#3
6.10%
#4
6.03%
#5
5.34%
#6
5.28%
#7
5.15%
#8
5.05%
#9
4.69%
#10
3.84%
What city has the Highest Percentage of Immigrants from Colombia in New York?
Napeague has the Highest Percentage of Immigrants from Colombia in New York with 20.78%.
What is the Percentage of Immigrants from Colombia in the State of New York?
Percentage of Immigrants from Colombia in New York is 0.56%.
What is the Percentage of Immigrants from Colombia in the United States?
Percentage of Immigrants from Colombia in the United States is 0.26%.