Cities with the Highest Percentage of Immigrants from Colombia in Massachusetts
RELATED REPORTS & OPTIONS
Colombia
Massachusetts
Compare Cities
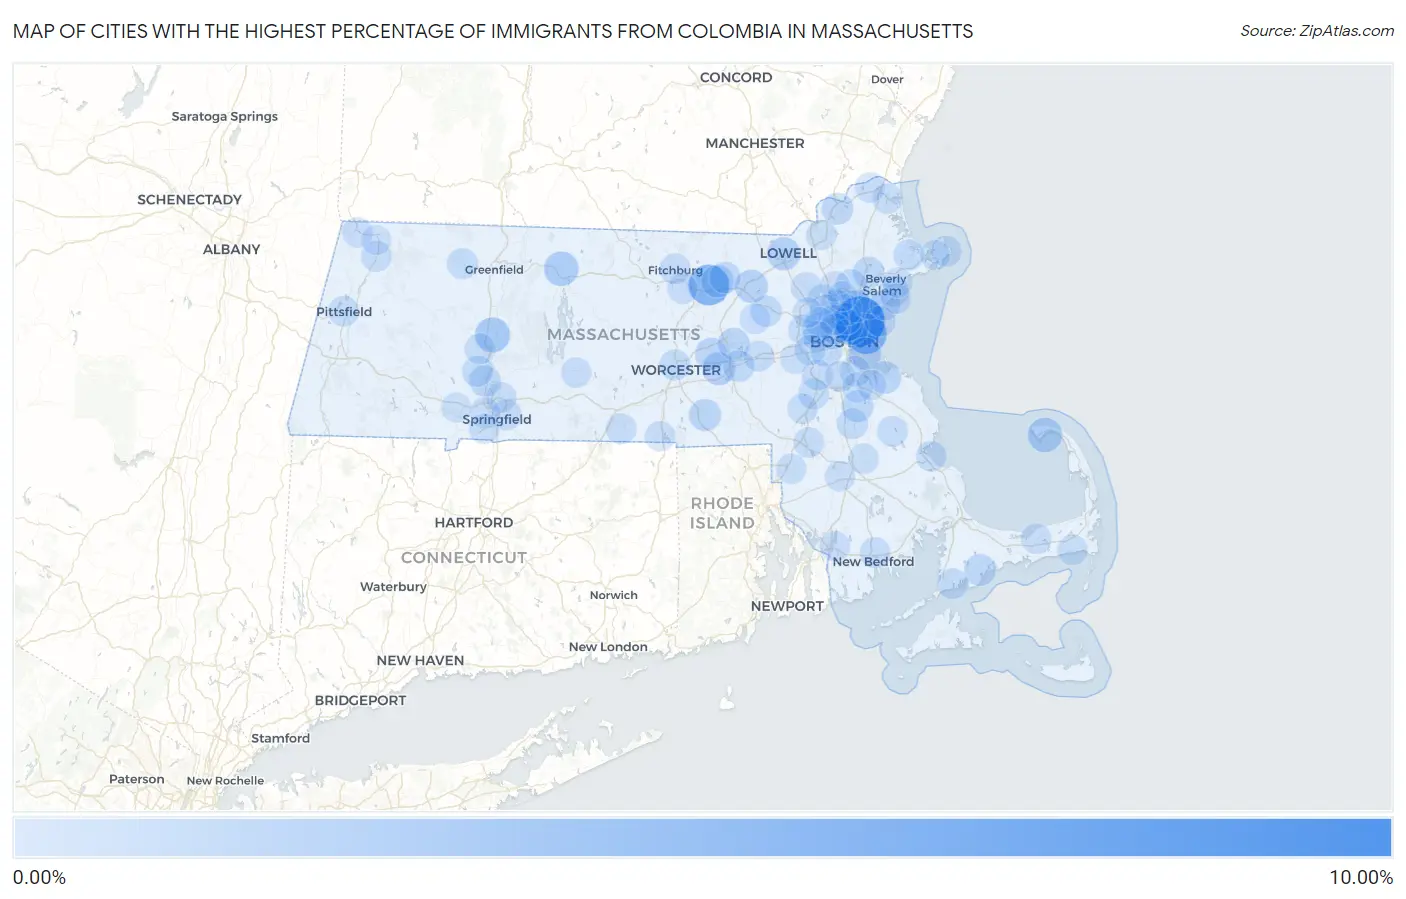
Map of Cities with the Highest Percentage of Immigrants from Colombia in Massachusetts
0.00%
10.00%
Cities with the Highest Percentage of Immigrants from Colombia in Massachusetts
| City | Colombia | vs State | vs National | |
| 1. | Revere | 8.34% | 0.40%(+7.94)#2 | 0.26%(+8.08)#359 |
| 2. | Shirley | 4.49% | 0.40%(+4.09)#3 | 0.26%(+4.23)#360 |
| 3. | Winthrop Town | 4.42% | 0.40%(+4.03)#4 | 0.26%(+4.16)#361 |
| 4. | Chelsea | 2.09% | 0.40%(+1.69)#5 | 0.26%(+1.83)#362 |
| 5. | Hatfield | 2.03% | 0.40%(+1.63)#32 | 0.26%(+1.77)#2,538 |
| 6. | Provincetown | 1.81% | 0.40%(+1.41)#33 | 0.26%(+1.55)#2,539 |
| 7. | Orange | 1.80% | 0.40%(+1.40)#34 | 0.26%(+1.54)#2,540 |
| 8. | Everett | 1.40% | 0.40%(+1.00)#35 | 0.26%(+1.14)#2,541 |
| 9. | Lowell | 1.31% | 0.40%(+0.911)#36 | 0.26%(+1.05)#2,542 |
| 10. | Littleton Common | 1.25% | 0.40%(+0.856)#37 | 0.26%(+0.994)#2,543 |
| 11. | Westborough | 1.19% | 0.40%(+0.789)#38 | 0.26%(+0.927)#2,544 |
| 12. | Boston | 1.07% | 0.40%(+0.671)#39 | 0.26%(+0.809)#2,545 |
| 13. | Hingham | 1.03% | 0.40%(+0.636)#40 | 0.26%(+0.775)#2,546 |
| 14. | Devens | 0.96% | 0.40%(+0.566)#41 | 0.26%(+0.704)#2,547 |
| 15. | Saugus | 0.83% | 0.40%(+0.431)#42 | 0.26%(+0.570)#2,548 |
| 16. | Northborough | 0.81% | 0.40%(+0.411)#43 | 0.26%(+0.549)#2,549 |
| 17. | Marlborough | 0.80% | 0.40%(+0.402)#44 | 0.26%(+0.540)#2,550 |
| 18. | Whitinsville | 0.80% | 0.40%(+0.399)#45 | 0.26%(+0.537)#2,551 |
| 19. | Danvers | 0.73% | 0.40%(+0.336)#46 | 0.26%(+0.475)#2,552 |
| 20. | Mashpee Neck | 0.71% | 0.40%(+0.310)#47 | 0.26%(+0.449)#2,553 |
| 21. | Haverhill | 0.70% | 0.40%(+0.302)#48 | 0.26%(+0.440)#2,554 |
| 22. | Holbrook | 0.69% | 0.40%(+0.290)#49 | 0.26%(+0.428)#2,555 |
| 23. | Holyoke | 0.66% | 0.40%(+0.261)#51 | 0.26%(+0.400)#3,020 |
| 24. | Malden | 0.59% | 0.40%(+0.187)#52 | 0.26%(+0.325)#3,021 |
| 25. | Lynnfield | 0.58% | 0.40%(+0.182)#53 | 0.26%(+0.320)#3,022 |
| 26. | Ayer | 0.57% | 0.40%(+0.174)#54 | 0.26%(+0.313)#3,023 |
| 27. | Brookline | 0.57% | 0.40%(+0.173)#55 | 0.26%(+0.311)#3,024 |
| 28. | Cordaville | 0.52% | 0.40%(+0.122)#56 | 0.26%(+0.260)#3,025 |
| 29. | West Concord | 0.50% | 0.40%(+0.098)#57 | 0.26%(+0.236)#3,088 |
| 30. | Melrose | 0.48% | 0.40%(+0.084)#58 | 0.26%(+0.222)#3,089 |
| 31. | Norwood | 0.47% | 0.40%(+0.074)#59 | 0.26%(+0.212)#3,090 |
| 32. | Essex | 0.43% | 0.40%(+0.027)#60 | 0.26%(+0.166)#3,091 |
| 33. | Shelburne Falls | 0.41% | 0.40%(+0.014)#61 | 0.26%(+0.152)#3,092 |
| 34. | Worcester | 0.39% | 0.40%(-0.006)#62 | 0.26%(+0.132)#3,093 |
| 35. | Stoneham | 0.39% | 0.40%(-0.007)#63 | 0.26%(+0.131)#3,094 |
| 36. | Teaticket | 0.38% | 0.40%(-0.014)#64 | 0.26%(+0.124)#3,095 |
| 37. | Waltham | 0.38% | 0.40%(-0.018)#65 | 0.26%(+0.120)#3,096 |
| 38. | Brockton | 0.37% | 0.40%(-0.026)#66 | 0.26%(+0.112)#3,097 |
| 39. | Cambridge | 0.37% | 0.40%(-0.028)#67 | 0.26%(+0.110)#3,098 |
| 40. | Easthampton Town | 0.36% | 0.40%(-0.039)#68 | 0.26%(+0.099)#3,099 |
| 41. | Amherst | 0.34% | 0.40%(-0.057)#69 | 0.26%(+0.081)#3,100 |
| 42. | Belmont | 0.34% | 0.40%(-0.057)#70 | 0.26%(+0.081)#3,101 |
| 43. | Rockport | 0.32% | 0.40%(-0.074)#71 | 0.26%(+0.064)#3,102 |
| 44. | Lynn | 0.32% | 0.40%(-0.076)#72 | 0.26%(+0.062)#3,103 |
| 45. | Woburn | 0.32% | 0.40%(-0.079)#73 | 0.26%(+0.060)#3,104 |
| 46. | Adams | 0.31% | 0.40%(-0.084)#74 | 0.26%(+0.055)#3,105 |
| 47. | Winchester | 0.31% | 0.40%(-0.091)#75 | 0.26%(+0.047)#3,106 |
| 48. | Somerville | 0.30% | 0.40%(-0.100)#76 | 0.26%(+0.038)#3,107 |
| 49. | Pinehurst | 0.30% | 0.40%(-0.103)#77 | 0.26%(+0.036)#3,108 |
| 50. | Southbridge Town | 0.29% | 0.40%(-0.110)#78 | 0.26%(+0.029)#3,109 |
| 51. | Hanson | 0.29% | 0.40%(-0.111)#79 | 0.26%(+0.028)#3,110 |
| 52. | Framingham | 0.28% | 0.40%(-0.117)#80 | 0.26%(+0.021)#3,111 |
| 53. | Dedham | 0.28% | 0.40%(-0.120)#81 | 0.26%(+0.018)#3,112 |
| 54. | Mansfield Center | 0.27% | 0.40%(-0.125)#82 | 0.26%(+0.013)#3,113 |
| 55. | Northampton | 0.27% | 0.40%(-0.126)#83 | 0.26%(+0.013)#3,114 |
| 56. | Salem | 0.24% | 0.40%(-0.156)#84 | 0.26%(-0.018)#3,115 |
| 57. | Pittsfield | 0.24% | 0.40%(-0.156)#85 | 0.26%(-0.018)#3,116 |
| 58. | Nahant | 0.24% | 0.40%(-0.158)#86 | 0.26%(-0.020)#3,117 |
| 59. | Fitchburg | 0.23% | 0.40%(-0.165)#87 | 0.26%(-0.027)#3,118 |
| 60. | Springfield | 0.23% | 0.40%(-0.166)#88 | 0.26%(-0.028)#3,119 |
| 61. | North Plymouth | 0.23% | 0.40%(-0.172)#89 | 0.26%(-0.034)#3,120 |
| 62. | Medford | 0.22% | 0.40%(-0.175)#90 | 0.26%(-0.036)#3,121 |
| 63. | Quincy | 0.22% | 0.40%(-0.177)#91 | 0.26%(-0.039)#3,122 |
| 64. | Milton | 0.22% | 0.40%(-0.180)#92 | 0.26%(-0.042)#3,123 |
| 65. | New Bedford | 0.22% | 0.40%(-0.183)#93 | 0.26%(-0.044)#3,124 |
| 66. | Chicopee | 0.21% | 0.40%(-0.189)#94 | 0.26%(-0.051)#3,125 |
| 67. | Braintree Town | 0.21% | 0.40%(-0.192)#95 | 0.26%(-0.054)#3,126 |
| 68. | North Attleborough | 0.20% | 0.40%(-0.193)#96 | 0.26%(-0.055)#3,127 |
| 69. | Ware | 0.19% | 0.40%(-0.206)#97 | 0.26%(-0.068)#3,128 |
| 70. | Maynard | 0.18% | 0.40%(-0.220)#98 | 0.26%(-0.082)#3,129 |
| 71. | Harwich Port | 0.18% | 0.40%(-0.221)#99 | 0.26%(-0.082)#3,130 |
| 72. | West Springfield Town | 0.17% | 0.40%(-0.231)#100 | 0.26%(-0.093)#3,131 |
| 73. | Arlington | 0.16% | 0.40%(-0.235)#101 | 0.26%(-0.097)#3,132 |
| 74. | Watertown Town | 0.16% | 0.40%(-0.236)#102 | 0.26%(-0.098)#3,133 |
| 75. | Newton | 0.16% | 0.40%(-0.241)#103 | 0.26%(-0.103)#3,134 |
| 76. | Leominster | 0.16% | 0.40%(-0.242)#104 | 0.26%(-0.104)#3,135 |
| 77. | Williamstown | 0.16% | 0.40%(-0.243)#105 | 0.26%(-0.104)#3,136 |
| 78. | Taunton | 0.15% | 0.40%(-0.243)#106 | 0.26%(-0.105)#3,137 |
| 79. | Yarmouth Port | 0.15% | 0.40%(-0.247)#107 | 0.26%(-0.109)#3,138 |
| 80. | Reading | 0.15% | 0.40%(-0.249)#108 | 0.26%(-0.110)#3,139 |
| 81. | Walpole | 0.14% | 0.40%(-0.257)#109 | 0.26%(-0.119)#3,140 |
| 82. | Lawrence | 0.14% | 0.40%(-0.261)#110 | 0.26%(-0.123)#3,141 |
| 83. | Fall River | 0.13% | 0.40%(-0.264)#111 | 0.26%(-0.125)#3,142 |
| 84. | Attleboro | 0.11% | 0.40%(-0.288)#112 | 0.26%(-0.150)#3,143 |
| 85. | Bridgewater Town | 0.11% | 0.40%(-0.290)#113 | 0.26%(-0.151)#3,144 |
| 86. | Swampscott | 0.11% | 0.40%(-0.292)#114 | 0.26%(-0.154)#3,145 |
| 87. | Agawam Town | 0.10% | 0.40%(-0.293)#115 | 0.26%(-0.155)#3,146 |
| 88. | Newburyport | 0.087% | 0.40%(-0.311)#116 | 0.26%(-0.173)#3,147 |
| 89. | Amesbury Town | 0.087% | 0.40%(-0.311)#117 | 0.26%(-0.173)#3,148 |
| 90. | Webster | 0.082% | 0.40%(-0.317)#118 | 0.26%(-0.178)#3,149 |
| 91. | Greenfield | 0.079% | 0.40%(-0.319)#119 | 0.26%(-0.181)#3,150 |
| 92. | Marblehead | 0.074% | 0.40%(-0.324)#120 | 0.26%(-0.186)#3,151 |
| 93. | Weymouth Town | 0.065% | 0.40%(-0.334)#121 | 0.26%(-0.195)#3,152 |
| 94. | Lexington | 0.064% | 0.40%(-0.334)#122 | 0.26%(-0.196)#3,153 |
| 95. | Wellesley | 0.054% | 0.40%(-0.345)#123 | 0.26%(-0.206)#3,154 |
| 96. | Beverly | 0.052% | 0.40%(-0.346)#124 | 0.26%(-0.208)#3,155 |
| 97. | Gloucester | 0.050% | 0.40%(-0.348)#125 | 0.26%(-0.210)#3,156 |
| 98. | Westfield | 0.037% | 0.40%(-0.361)#126 | 0.26%(-0.223)#3,157 |
| 99. | Wakefield | 0.033% | 0.40%(-0.365)#127 | 0.26%(-0.227)#3,158 |
| 100. | North Adams | 0.031% | 0.40%(-0.367)#128 | 0.26%(-0.229)#3,159 |
Common Questions
What are the Top 10 Cities with the Highest Percentage of Immigrants from Colombia in Massachusetts?
Top 10 Cities with the Highest Percentage of Immigrants from Colombia in Massachusetts are:
#1
8.34%
#2
4.49%
#3
4.42%
#4
2.09%
#5
2.03%
#6
1.81%
#7
1.80%
#8
1.40%
#9
1.31%
#10
1.25%
What city has the Highest Percentage of Immigrants from Colombia in Massachusetts?
Revere has the Highest Percentage of Immigrants from Colombia in Massachusetts with 8.34%.
What is the Percentage of Immigrants from Colombia in the State of Massachusetts?
Percentage of Immigrants from Colombia in Massachusetts is 0.40%.
What is the Percentage of Immigrants from Colombia in the United States?
Percentage of Immigrants from Colombia in the United States is 0.26%.