Cities with the Highest Percentage of Population Employed in Personal Care and Service in Pennsylvania
RELATED REPORTS & OPTIONS
Personal Care and Service
Pennsylvania
Compare Cities
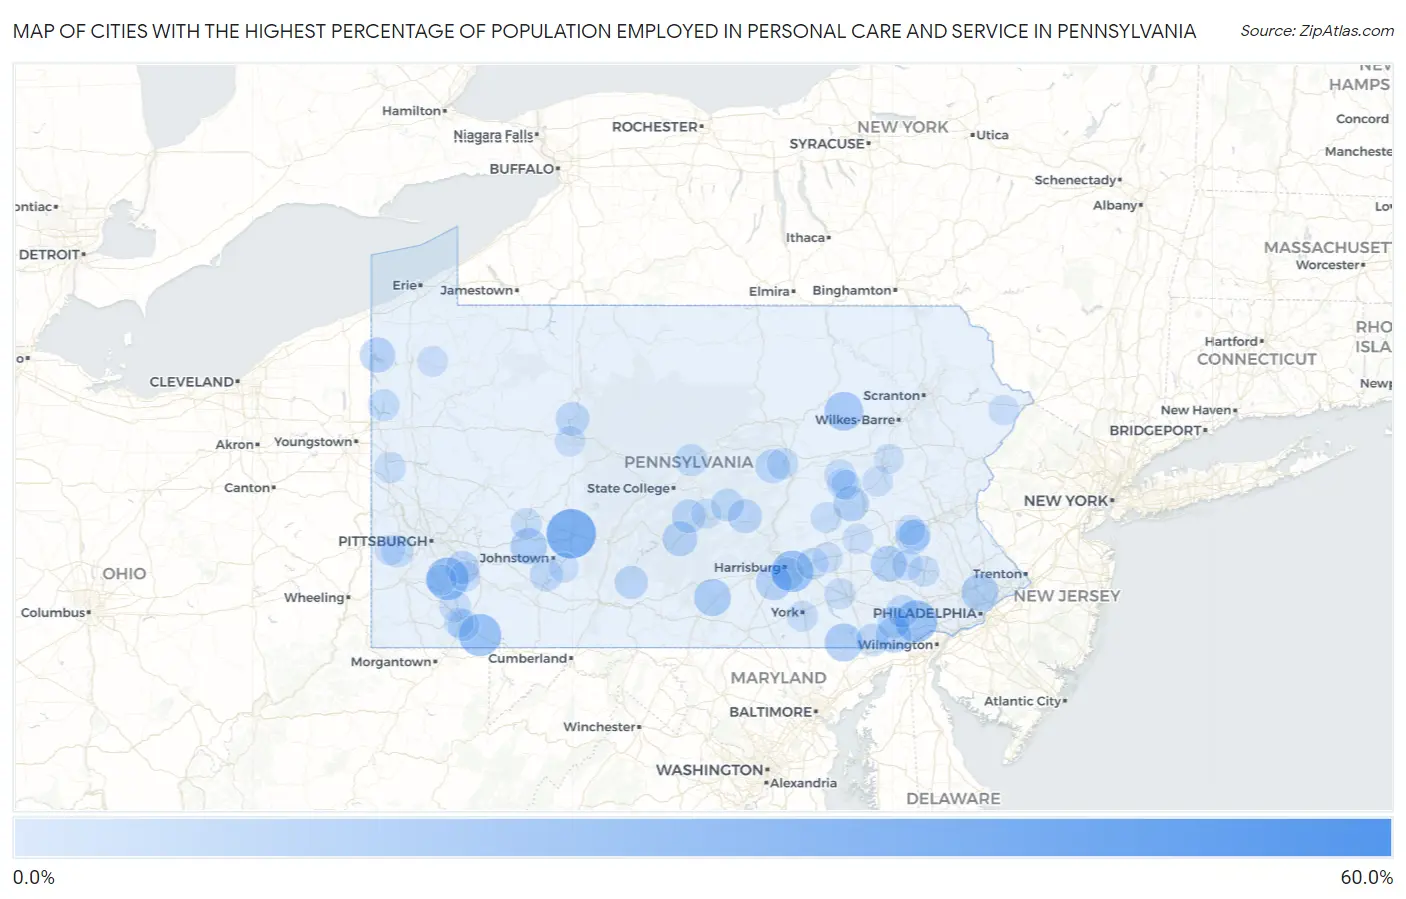
Map of Cities with the Highest Percentage of Population Employed in Personal Care and Service in Pennsylvania
0.0%
60.0%
Cities with the Highest Percentage of Population Employed in Personal Care and Service in Pennsylvania
| City | % Employed | vs State | vs National | |
| 1. | Puzzletown | 58.6% | 2.4%(+56.2)#1 | 2.6%(+56.1)#31 |
| 2. | Revloc | 38.6% | 2.4%(+36.2)#2 | 2.6%(+36.1)#68 |
| 3. | Seven Springs Borough | 31.2% | 2.4%(+28.8)#3 | 2.6%(+28.7)#111 |
| 4. | Bear Lake Borough | 29.3% | 2.4%(+26.9)#4 | 2.6%(+26.8)#123 |
| 5. | Webster | 27.3% | 2.4%(+24.8)#5 | 2.6%(+24.7)#134 |
| 6. | Farmington | 27.0% | 2.4%(+24.6)#6 | 2.6%(+24.4)#138 |
| 7. | Unionville | 26.7% | 2.4%(+24.2)#7 | 2.6%(+24.1)#143 |
| 8. | Oberlin | 26.0% | 2.4%(+23.6)#8 | 2.6%(+23.5)#149 |
| 9. | University Of Pittsburgh Bradford | 24.7% | 2.4%(+22.2)#9 | 2.6%(+22.1)#165 |
| 10. | Jamison City | 21.7% | 2.4%(+19.3)#10 | 2.6%(+19.1)#215 |
| 11. | St Clairsville Borough | 20.5% | 2.4%(+18.1)#11 | 2.6%(+18.0)#243 |
| 12. | Susquehanna Trails | 20.3% | 2.4%(+17.9)#12 | 2.6%(+17.8)#246 |
| 13. | Arcadia University | 18.9% | 2.4%(+16.5)#13 | 2.6%(+16.3)#273 |
| 14. | Shippensburg University | 18.9% | 2.4%(+16.4)#14 | 2.6%(+16.3)#275 |
| 15. | Carlisle Barracks | 18.4% | 2.4%(+15.9)#15 | 2.6%(+15.8)#287 |
| 16. | Robinson | 18.0% | 2.4%(+15.6)#16 | 2.6%(+15.5)#307 |
| 17. | Pennwyn | 17.4% | 2.4%(+14.9)#17 | 2.6%(+14.8)#324 |
| 18. | Lincoln University | 16.6% | 2.4%(+14.1)#18 | 2.6%(+14.0)#356 |
| 19. | Messiah College | 16.5% | 2.4%(+14.1)#19 | 2.6%(+14.0)#358 |
| 20. | Westover Borough | 16.4% | 2.4%(+14.0)#20 | 2.6%(+13.9)#361 |
| 21. | Forestville | 16.2% | 2.4%(+13.8)#21 | 2.6%(+13.6)#372 |
| 22. | Sproul | 16.2% | 2.4%(+13.8)#22 | 2.6%(+13.6)#374 |
| 23. | Pymatuning North | 15.9% | 2.4%(+13.5)#23 | 2.6%(+13.4)#384 |
| 24. | Atkinson Mills | 15.5% | 2.4%(+13.0)#24 | 2.6%(+12.9)#407 |
| 25. | Vicksburg | 14.5% | 2.4%(+12.0)#25 | 2.6%(+11.9)#456 |
| 26. | Mckee | 14.4% | 2.4%(+12.0)#26 | 2.6%(+11.9)#457 |
| 27. | Eastvale Borough | 14.3% | 2.4%(+11.8)#27 | 2.6%(+11.7)#466 |
| 28. | East Salem | 14.1% | 2.4%(+11.7)#28 | 2.6%(+11.6)#480 |
| 29. | Belleville | 13.9% | 2.4%(+11.5)#29 | 2.6%(+11.4)#495 |
| 30. | Dryville | 13.8% | 2.4%(+11.3)#30 | 2.6%(+11.2)#499 |
| 31. | Hunker Borough | 13.6% | 2.4%(+11.2)#31 | 2.6%(+11.1)#514 |
| 32. | Crenshaw | 13.6% | 2.4%(+11.2)#32 | 2.6%(+11.0)#519 |
| 33. | Defiance | 13.2% | 2.4%(+10.8)#33 | 2.6%(+10.6)#540 |
| 34. | Ore Hill | 13.1% | 2.4%(+10.7)#34 | 2.6%(+10.6)#551 |
| 35. | Herminie | 13.1% | 2.4%(+10.6)#35 | 2.6%(+10.5)#552 |
| 36. | Jerome | 12.6% | 2.4%(+10.2)#36 | 2.6%(+10.1)#591 |
| 37. | Wagner | 12.5% | 2.4%(+10.1)#37 | 2.6%(+9.94)#611 |
| 38. | Blue Knob | 12.5% | 2.4%(+10.1)#38 | 2.6%(+9.94)#612 |
| 39. | Little Britain | 12.4% | 2.4%(+9.98)#39 | 2.6%(+9.86)#618 |
| 40. | New Market | 12.4% | 2.4%(+9.91)#40 | 2.6%(+9.79)#626 |
| 41. | Westwood | 12.1% | 2.4%(+9.66)#41 | 2.6%(+9.54)#652 |
| 42. | Port Vue Borough | 11.9% | 2.4%(+9.42)#42 | 2.6%(+9.31)#676 |
| 43. | Misericordia University | 11.9% | 2.4%(+9.42)#43 | 2.6%(+9.30)#678 |
| 44. | Cochranville | 11.8% | 2.4%(+9.32)#44 | 2.6%(+9.20)#688 |
| 45. | New Baltimore Borough | 11.6% | 2.4%(+9.18)#45 | 2.6%(+9.07)#702 |
| 46. | Midway | 11.5% | 2.4%(+9.05)#46 | 2.6%(+8.93)#718 |
| 47. | Mount Eagle | 11.5% | 2.4%(+9.03)#47 | 2.6%(+8.91)#720 |
| 48. | Patterson Heights Borough | 11.3% | 2.4%(+8.82)#48 | 2.6%(+8.70)#745 |
| 49. | Ursina Borough | 11.1% | 2.4%(+8.66)#49 | 2.6%(+8.55)#770 |
| 50. | Penn State Berks | 11.0% | 2.4%(+8.51)#50 | 2.6%(+8.39)#789 |
| 51. | Hershey | 10.8% | 2.4%(+8.40)#51 | 2.6%(+8.28)#807 |
| 52. | Reynolds Heights | 10.8% | 2.4%(+8.32)#52 | 2.6%(+8.21)#819 |
| 53. | Hopwood | 10.6% | 2.4%(+8.19)#53 | 2.6%(+8.08)#830 |
| 54. | Bowers | 10.6% | 2.4%(+8.19)#54 | 2.6%(+8.08)#833 |
| 55. | Swedeland | 10.5% | 2.4%(+8.08)#55 | 2.6%(+7.96)#844 |
| 56. | Georgetown Cdp Luzerne County | 10.5% | 2.4%(+8.04)#56 | 2.6%(+7.93)#848 |
| 57. | Cheswick Borough | 10.5% | 2.4%(+8.04)#57 | 2.6%(+7.92)#850 |
| 58. | New Milford Borough | 10.5% | 2.4%(+8.01)#58 | 2.6%(+7.90)#852 |
| 59. | Numidia | 10.4% | 2.4%(+7.97)#59 | 2.6%(+7.85)#855 |
| 60. | Linntown | 10.4% | 2.4%(+7.91)#60 | 2.6%(+7.79)#865 |
| 61. | West Pittsburg | 10.3% | 2.4%(+7.84)#61 | 2.6%(+7.73)#874 |
| 62. | Smock | 10.1% | 2.4%(+7.70)#62 | 2.6%(+7.58)#906 |
| 63. | Lucerne Mines | 9.9% | 2.4%(+7.50)#63 | 2.6%(+7.38)#941 |
| 64. | Dushore Borough | 9.8% | 2.4%(+7.38)#64 | 2.6%(+7.26)#958 |
| 65. | Glenfield Borough | 9.8% | 2.4%(+7.33)#65 | 2.6%(+7.21)#968 |
| 66. | Muir | 9.8% | 2.4%(+7.33)#66 | 2.6%(+7.21)#970 |
| 67. | Fayette City Borough | 9.7% | 2.4%(+7.28)#67 | 2.6%(+7.17)#985 |
| 68. | Landisville | 9.7% | 2.4%(+7.23)#68 | 2.6%(+7.12)#989 |
| 69. | Grantley | 9.6% | 2.4%(+7.19)#69 | 2.6%(+7.08)#1,002 |
| 70. | Loretto Borough | 9.6% | 2.4%(+7.16)#70 | 2.6%(+7.05)#1,009 |
| 71. | Wilburton Number Two | 9.5% | 2.4%(+7.08)#71 | 2.6%(+6.96)#1,024 |
| 72. | South Pottstown | 9.5% | 2.4%(+7.06)#72 | 2.6%(+6.95)#1,033 |
| 73. | Rehrersburg | 9.4% | 2.4%(+7.00)#73 | 2.6%(+6.89)#1,039 |
| 74. | Mckees Rocks Borough | 9.4% | 2.4%(+7.00)#74 | 2.6%(+6.88)#1,042 |
| 75. | Wyano | 9.4% | 2.4%(+6.98)#75 | 2.6%(+6.86)#1,048 |
| 76. | Sandy | 9.4% | 2.4%(+6.96)#76 | 2.6%(+6.84)#1,053 |
| 77. | Eau Claire Borough | 9.4% | 2.4%(+6.93)#77 | 2.6%(+6.81)#1,060 |
| 78. | Guys Mills | 9.4% | 2.4%(+6.93)#78 | 2.6%(+6.81)#1,063 |
| 79. | Wickerham Manor Fisher | 9.4% | 2.4%(+6.92)#79 | 2.6%(+6.80)#1,064 |
| 80. | Baumstown | 9.3% | 2.4%(+6.88)#80 | 2.6%(+6.76)#1,074 |
| 81. | Alba Borough | 9.2% | 2.4%(+6.76)#81 | 2.6%(+6.65)#1,093 |
| 82. | Joffre | 9.1% | 2.4%(+6.70)#82 | 2.6%(+6.58)#1,110 |
| 83. | Delano | 9.1% | 2.4%(+6.64)#83 | 2.6%(+6.53)#1,120 |
| 84. | Kutztown University | 9.0% | 2.4%(+6.52)#84 | 2.6%(+6.41)#1,153 |
| 85. | Shinglehouse Borough | 8.9% | 2.4%(+6.45)#85 | 2.6%(+6.34)#1,170 |
| 86. | Sunrise Lake | 8.8% | 2.4%(+6.34)#86 | 2.6%(+6.23)#1,204 |
| 87. | Annville | 8.8% | 2.4%(+6.32)#87 | 2.6%(+6.20)#1,217 |
| 88. | West Easton Borough | 8.7% | 2.4%(+6.23)#88 | 2.6%(+6.12)#1,239 |
| 89. | Brisbin Borough | 8.7% | 2.4%(+6.22)#89 | 2.6%(+6.11)#1,243 |
| 90. | South Uniontown | 8.6% | 2.4%(+6.16)#90 | 2.6%(+6.05)#1,253 |
| 91. | Aristes | 8.6% | 2.4%(+6.16)#91 | 2.6%(+6.04)#1,257 |
| 92. | Highland Park | 8.6% | 2.4%(+6.13)#92 | 2.6%(+6.02)#1,265 |
| 93. | Freeport Borough | 8.5% | 2.4%(+6.09)#93 | 2.6%(+5.97)#1,279 |
| 94. | Richlandtown Borough | 8.5% | 2.4%(+6.01)#94 | 2.6%(+5.89)#1,298 |
| 95. | Waynesburg Borough | 8.4% | 2.4%(+5.98)#95 | 2.6%(+5.87)#1,306 |
| 96. | University Of Pittsburgh Johnstown | 8.4% | 2.4%(+5.97)#96 | 2.6%(+5.85)#1,309 |
| 97. | Harleigh | 8.3% | 2.4%(+5.83)#97 | 2.6%(+5.72)#1,352 |
| 98. | Moose Run | 8.3% | 2.4%(+5.82)#98 | 2.6%(+5.70)#1,356 |
| 99. | Yeadon Borough | 8.3% | 2.4%(+5.81)#99 | 2.6%(+5.69)#1,360 |
| 100. | Royalton Borough | 8.2% | 2.4%(+5.75)#100 | 2.6%(+5.64)#1,371 |
Common Questions
What are the Top 10 Cities with the Highest Percentage of Population Employed in Personal Care and Service in Pennsylvania?
Top 10 Cities with the Highest Percentage of Population Employed in Personal Care and Service in Pennsylvania are:
#1
38.6%
#2
27.3%
#3
27.0%
#4
26.7%
#5
26.0%
#6
21.7%
#7
20.3%
#8
18.9%
#9
18.9%
#10
18.0%
What city has the Highest Percentage of Population Employed in Personal Care and Service in Pennsylvania?
Revloc has the Highest Percentage of Population Employed in Personal Care and Service in Pennsylvania with 38.6%.
What is the Percentage of Population Employed in Personal Care and Service in the State of Pennsylvania?
Percentage of Population Employed in Personal Care and Service in Pennsylvania is 2.4%.
What is the Percentage of Population Employed in Personal Care and Service in the United States?
Percentage of Population Employed in Personal Care and Service in the United States is 2.6%.