Cities with the Highest Percentage of Population Employed in Personal Care and Service in Virginia
RELATED REPORTS & OPTIONS
Personal Care and Service
Virginia
Compare Cities
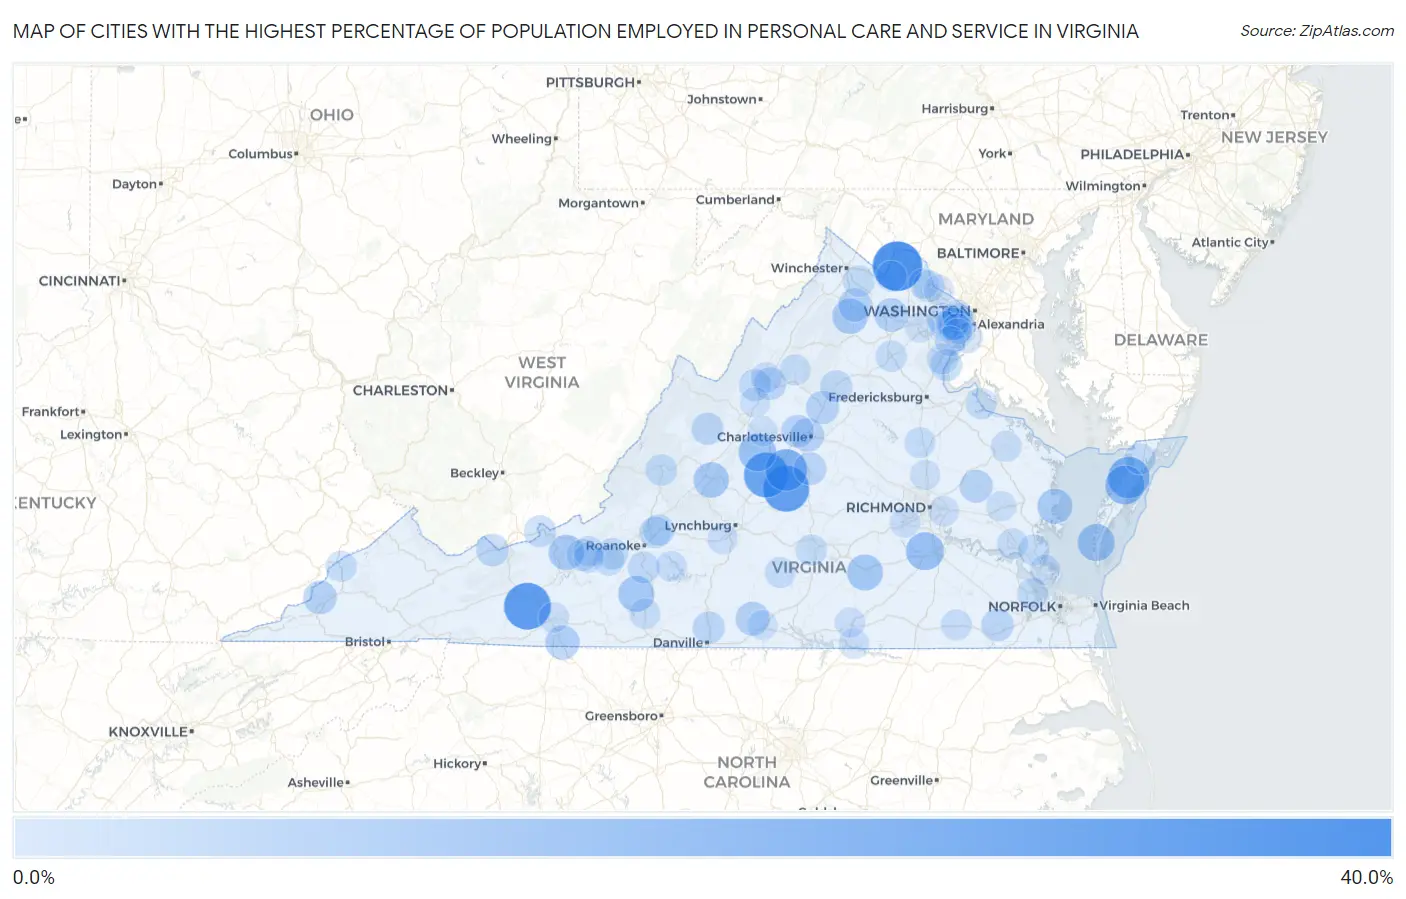
Map of Cities with the Highest Percentage of Population Employed in Personal Care and Service in Virginia
0.0%
40.0%
Cities with the Highest Percentage of Population Employed in Personal Care and Service in Virginia
| City | % Employed | vs State | vs National | |
| 1. | Hillsboro | 37.0% | 2.6%(+34.4)#1 | 2.6%(+34.4)#74 |
| 2. | Ivanhoe | 32.3% | 2.6%(+29.7)#2 | 2.6%(+29.7)#103 |
| 3. | Yogaville | 30.8% | 2.6%(+28.2)#3 | 2.6%(+28.2)#114 |
| 4. | Lovingston | 28.8% | 2.6%(+26.2)#4 | 2.6%(+26.2)#125 |
| 5. | Weems | 24.1% | 2.6%(+21.5)#5 | 2.6%(+21.5)#173 |
| 6. | Schuyler | 23.5% | 2.6%(+20.9)#6 | 2.6%(+20.9)#181 |
| 7. | Greenbush | 22.7% | 2.6%(+20.1)#7 | 2.6%(+20.2)#198 |
| 8. | Onley | 18.9% | 2.6%(+16.3)#8 | 2.6%(+16.3)#274 |
| 9. | Matoaca | 16.8% | 2.6%(+14.3)#9 | 2.6%(+14.3)#341 |
| 10. | Wintergreen | 16.3% | 2.6%(+13.7)#10 | 2.6%(+13.7)#368 |
| 11. | Cheriton | 15.4% | 2.6%(+12.8)#11 | 2.6%(+12.8)#411 |
| 12. | Baywood | 15.1% | 2.6%(+12.5)#12 | 2.6%(+12.5)#421 |
| 13. | Blackstone | 13.5% | 2.6%(+10.9)#13 | 2.6%(+11.0)#525 |
| 14. | Ferrum | 13.3% | 2.6%(+10.7)#14 | 2.6%(+10.7)#531 |
| 15. | Buena Vista | 12.6% | 2.6%(+9.99)#15 | 2.6%(+10.0)#598 |
| 16. | Chester Gap | 12.6% | 2.6%(+9.99)#16 | 2.6%(+10.0)#599 |
| 17. | Parrott | 12.5% | 2.6%(+9.91)#17 | 2.6%(+9.94)#604 |
| 18. | Deltaville | 12.0% | 2.6%(+9.44)#18 | 2.6%(+9.47)#662 |
| 19. | Cana | 10.4% | 2.6%(+7.80)#19 | 2.6%(+7.82)#862 |
| 20. | The University Of Virginia's College At Wise | 10.0% | 2.6%(+7.44)#20 | 2.6%(+7.47)#918 |
| 21. | Mountain Road | 10.0% | 2.6%(+7.39)#21 | 2.6%(+7.41)#936 |
| 22. | Dinwiddie | 9.9% | 2.6%(+7.31)#22 | 2.6%(+7.33)#947 |
| 23. | University Of Virginia | 9.5% | 2.6%(+6.87)#23 | 2.6%(+6.89)#1,038 |
| 24. | Appalachia | 9.4% | 2.6%(+6.83)#24 | 2.6%(+6.85)#1,051 |
| 25. | The Plains | 9.4% | 2.6%(+6.81)#25 | 2.6%(+6.83)#1,056 |
| 26. | Skyland Estates | 9.3% | 2.6%(+6.72)#26 | 2.6%(+6.74)#1,078 |
| 27. | Ruckersville | 9.0% | 2.6%(+6.45)#27 | 2.6%(+6.48)#1,137 |
| 28. | North Springfield | 8.8% | 2.6%(+6.20)#28 | 2.6%(+6.22)#1,210 |
| 29. | King William | 8.6% | 2.6%(+6.06)#29 | 2.6%(+6.08)#1,247 |
| 30. | Scottsville | 8.2% | 2.6%(+5.63)#30 | 2.6%(+5.65)#1,368 |
| 31. | Ivy | 8.2% | 2.6%(+5.61)#31 | 2.6%(+5.63)#1,373 |
| 32. | Bluefield | 7.9% | 2.6%(+5.30)#32 | 2.6%(+5.33)#1,479 |
| 33. | Carrsville | 7.8% | 2.6%(+5.23)#33 | 2.6%(+5.25)#1,510 |
| 34. | Massanetta Springs | 7.5% | 2.6%(+4.91)#34 | 2.6%(+4.94)#1,629 |
| 35. | Kings Park | 7.1% | 2.6%(+4.53)#35 | 2.6%(+4.55)#1,774 |
| 36. | Blairs | 7.1% | 2.6%(+4.51)#36 | 2.6%(+4.53)#1,785 |
| 37. | Craigsville | 7.0% | 2.6%(+4.41)#37 | 2.6%(+4.43)#1,831 |
| 38. | Moneta | 6.9% | 2.6%(+4.29)#38 | 2.6%(+4.31)#1,901 |
| 39. | Bridgewater | 6.8% | 2.6%(+4.23)#39 | 2.6%(+4.25)#1,939 |
| 40. | Quantico | 6.8% | 2.6%(+4.20)#40 | 2.6%(+4.22)#1,950 |
| 41. | Madison | 6.8% | 2.6%(+4.19)#41 | 2.6%(+4.22)#1,953 |
| 42. | Boones Mill | 6.8% | 2.6%(+4.19)#42 | 2.6%(+4.22)#1,956 |
| 43. | Moorefield | 6.7% | 2.6%(+4.12)#43 | 2.6%(+4.14)#1,989 |
| 44. | Glen Lyn | 6.7% | 2.6%(+4.08)#44 | 2.6%(+4.10)#2,012 |
| 45. | University Center | 6.4% | 2.6%(+3.83)#45 | 2.6%(+3.86)#2,155 |
| 46. | Laymantown | 6.4% | 2.6%(+3.83)#46 | 2.6%(+3.85)#2,157 |
| 47. | Blue Ridge | 6.3% | 2.6%(+3.74)#47 | 2.6%(+3.77)#2,214 |
| 48. | Prices Fork | 6.3% | 2.6%(+3.73)#48 | 2.6%(+3.76)#2,223 |
| 49. | Ravensworth | 6.3% | 2.6%(+3.72)#49 | 2.6%(+3.74)#2,235 |
| 50. | Boyce | 6.2% | 2.6%(+3.61)#50 | 2.6%(+3.63)#2,331 |
| 51. | Iron Gate | 6.1% | 2.6%(+3.48)#51 | 2.6%(+3.50)#2,426 |
| 52. | Elliston | 5.9% | 2.6%(+3.30)#52 | 2.6%(+3.32)#2,548 |
| 53. | George Mason | 5.9% | 2.6%(+3.29)#53 | 2.6%(+3.31)#2,572 |
| 54. | Bealeton | 5.8% | 2.6%(+3.21)#54 | 2.6%(+3.23)#2,648 |
| 55. | Dumfries | 5.7% | 2.6%(+3.07)#55 | 2.6%(+3.10)#2,764 |
| 56. | Carrollton | 5.6% | 2.6%(+3.04)#56 | 2.6%(+3.06)#2,807 |
| 57. | Hampden Sydney | 5.6% | 2.6%(+3.02)#57 | 2.6%(+3.05)#2,818 |
| 58. | Shawsville | 5.4% | 2.6%(+2.85)#58 | 2.6%(+2.87)#2,973 |
| 59. | Hallwood | 5.4% | 2.6%(+2.82)#59 | 2.6%(+2.84)#3,005 |
| 60. | Colonial Beach | 5.3% | 2.6%(+2.76)#60 | 2.6%(+2.78)#3,062 |
| 61. | Pound | 5.3% | 2.6%(+2.74)#61 | 2.6%(+2.77)#3,079 |
| 62. | Phenix | 5.3% | 2.6%(+2.71)#62 | 2.6%(+2.74)#3,103 |
| 63. | Yorktown | 5.3% | 2.6%(+2.71)#63 | 2.6%(+2.74)#3,104 |
| 64. | Lake Caroline | 5.3% | 2.6%(+2.71)#64 | 2.6%(+2.73)#3,107 |
| 65. | Harrisonburg | 5.3% | 2.6%(+2.67)#65 | 2.6%(+2.70)#3,153 |
| 66. | Shenandoah | 5.2% | 2.6%(+2.62)#66 | 2.6%(+2.64)#3,211 |
| 67. | Warsaw | 5.2% | 2.6%(+2.61)#67 | 2.6%(+2.64)#3,212 |
| 68. | Capron | 5.2% | 2.6%(+2.59)#68 | 2.6%(+2.61)#3,239 |
| 69. | Annandale | 5.1% | 2.6%(+2.55)#69 | 2.6%(+2.58)#3,270 |
| 70. | Round Hill | 5.1% | 2.6%(+2.54)#70 | 2.6%(+2.56)#3,299 |
| 71. | Williamsburg | 5.1% | 2.6%(+2.51)#71 | 2.6%(+2.53)#3,325 |
| 72. | Oak Level | 5.0% | 2.6%(+2.44)#72 | 2.6%(+2.47)#3,420 |
| 73. | Mount Vernon | 5.0% | 2.6%(+2.43)#73 | 2.6%(+2.45)#3,438 |
| 74. | Great Falls Crossing | 5.0% | 2.6%(+2.43)#74 | 2.6%(+2.45)#3,439 |
| 75. | Westlake Corner | 4.7% | 2.6%(+2.16)#75 | 2.6%(+2.18)#3,793 |
| 76. | Hillsville | 4.7% | 2.6%(+2.10)#76 | 2.6%(+2.12)#3,879 |
| 77. | Bethel Manor | 4.7% | 2.6%(+2.09)#77 | 2.6%(+2.11)#3,892 |
| 78. | Blacksburg | 4.6% | 2.6%(+2.01)#78 | 2.6%(+2.03)#4,004 |
| 79. | Burke Centre | 4.5% | 2.6%(+1.94)#79 | 2.6%(+1.96)#4,137 |
| 80. | Timberlake | 4.5% | 2.6%(+1.91)#80 | 2.6%(+1.93)#4,166 |
| 81. | Hutchison | 4.5% | 2.6%(+1.91)#81 | 2.6%(+1.93)#4,169 |
| 82. | Bracey | 4.5% | 2.6%(+1.87)#82 | 2.6%(+1.89)#4,233 |
| 83. | Sandston | 4.4% | 2.6%(+1.82)#83 | 2.6%(+1.85)#4,316 |
| 84. | Rio | 4.4% | 2.6%(+1.80)#84 | 2.6%(+1.83)#4,341 |
| 85. | South Hill | 4.4% | 2.6%(+1.78)#85 | 2.6%(+1.81)#4,378 |
| 86. | Brandermill | 4.3% | 2.6%(+1.72)#86 | 2.6%(+1.74)#4,475 |
| 87. | Merrimac | 4.2% | 2.6%(+1.62)#87 | 2.6%(+1.65)#4,648 |
| 88. | West Point | 4.2% | 2.6%(+1.62)#88 | 2.6%(+1.64)#4,654 |
| 89. | Waynesboro | 4.2% | 2.6%(+1.58)#89 | 2.6%(+1.60)#4,727 |
| 90. | Lansdowne | 4.1% | 2.6%(+1.56)#90 | 2.6%(+1.58)#4,781 |
| 91. | Ashland | 4.1% | 2.6%(+1.54)#91 | 2.6%(+1.56)#4,820 |
| 92. | West Falls Church | 4.1% | 2.6%(+1.52)#92 | 2.6%(+1.54)#4,850 |
| 93. | Springfield | 4.1% | 2.6%(+1.50)#93 | 2.6%(+1.52)#4,896 |
| 94. | Mount Sidney | 4.1% | 2.6%(+1.49)#94 | 2.6%(+1.51)#4,903 |
| 95. | Lowes Island | 4.1% | 2.6%(+1.48)#95 | 2.6%(+1.51)#4,920 |
| 96. | Earlysville | 4.0% | 2.6%(+1.41)#96 | 2.6%(+1.44)#5,038 |
| 97. | Newington | 4.0% | 2.6%(+1.41)#97 | 2.6%(+1.44)#5,065 |
| 98. | Bull Run | 4.0% | 2.6%(+1.37)#98 | 2.6%(+1.39)#5,153 |
| 99. | South Boston | 3.9% | 2.6%(+1.32)#99 | 2.6%(+1.34)#5,268 |
| 100. | Occoquan | 3.9% | 2.6%(+1.31)#100 | 2.6%(+1.33)#5,282 |
Common Questions
What are the Top 10 Cities with the Highest Percentage of Population Employed in Personal Care and Service in Virginia?
Top 10 Cities with the Highest Percentage of Population Employed in Personal Care and Service in Virginia are:
#1
37.0%
#2
32.3%
#3
30.8%
#4
28.8%
#5
23.5%
#6
22.7%
#7
18.9%
#8
16.8%
#9
16.3%
#10
15.4%
What city has the Highest Percentage of Population Employed in Personal Care and Service in Virginia?
Hillsboro has the Highest Percentage of Population Employed in Personal Care and Service in Virginia with 37.0%.
What is the Percentage of Population Employed in Personal Care and Service in the State of Virginia?
Percentage of Population Employed in Personal Care and Service in Virginia is 2.6%.
What is the Percentage of Population Employed in Personal Care and Service in the United States?
Percentage of Population Employed in Personal Care and Service in the United States is 2.6%.