Cities with the Highest Percentage of Population Employed in Personal Care and Service in Massachusetts
RELATED REPORTS & OPTIONS
Personal Care and Service
Massachusetts
Compare Cities
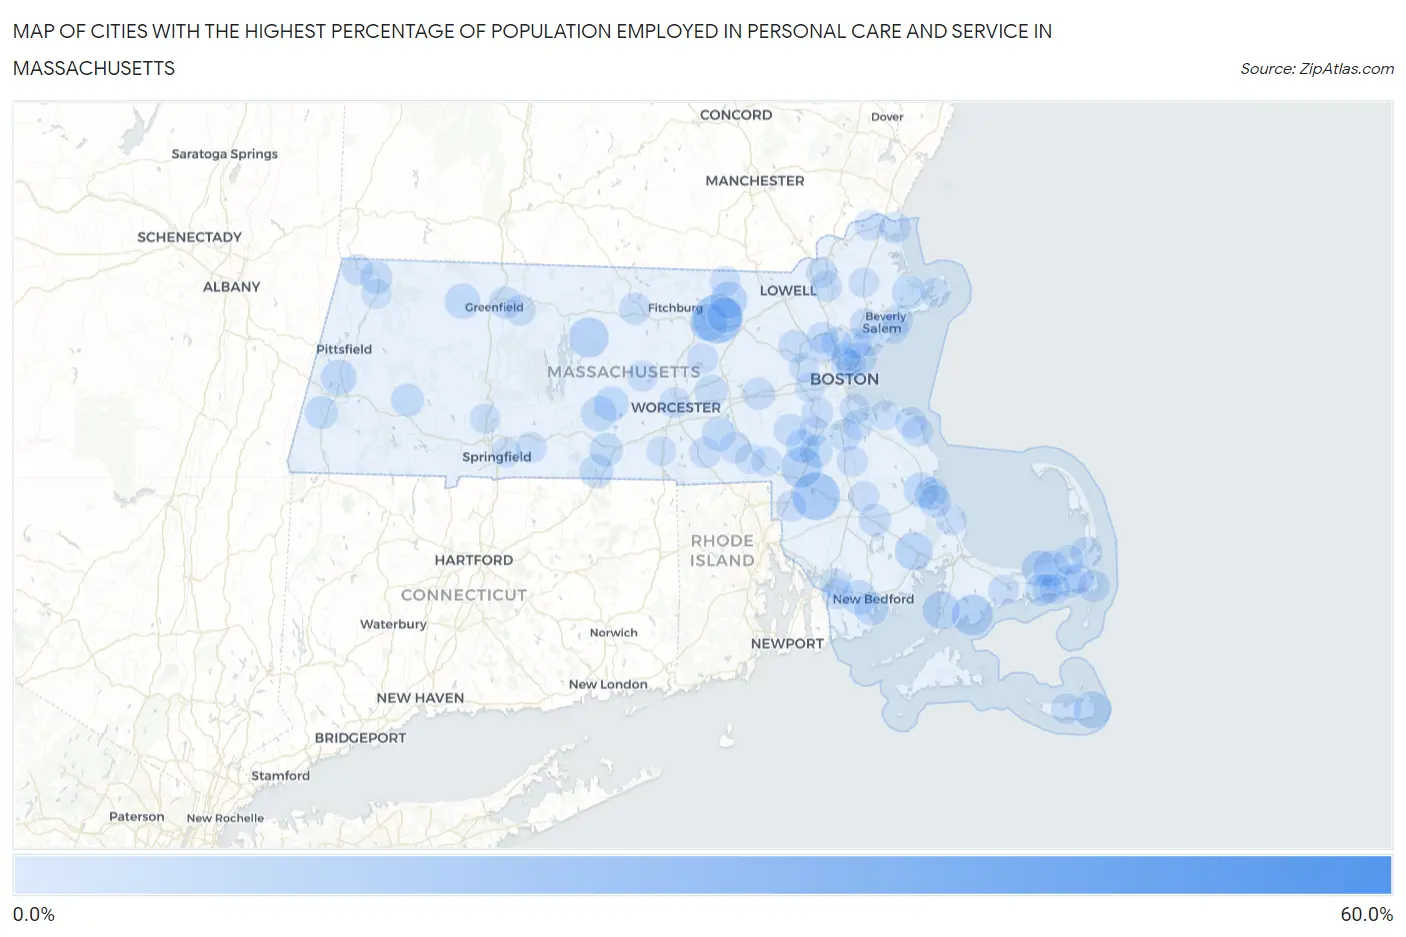
Map of Cities with the Highest Percentage of Population Employed in Personal Care and Service in Massachusetts
0.0%
60.0%
Cities with the Highest Percentage of Population Employed in Personal Care and Service in Massachusetts
| City | % Employed | vs State | vs National | |
| 1. | Lenox Dale | 53.2% | 2.8%(+50.4)#1 | 2.6%(+50.6)#37 |
| 2. | Devens | 15.9% | 2.8%(+13.1)#2 | 2.6%(+13.3)#387 |
| 3. | Norton Center | 14.8% | 2.8%(+12.0)#3 | 2.6%(+12.2)#439 |
| 4. | Seabrook | 10.4% | 2.8%(+7.62)#4 | 2.6%(+7.82)#863 |
| 5. | Foxborough | 10.2% | 2.8%(+7.42)#5 | 2.6%(+7.62)#899 |
| 6. | Petersham | 9.7% | 2.8%(+6.89)#6 | 2.6%(+7.09)#996 |
| 7. | West Wareham | 8.3% | 2.8%(+5.52)#7 | 2.6%(+5.73)#1,348 |
| 8. | Shirley | 8.0% | 2.8%(+5.19)#8 | 2.6%(+5.39)#1,451 |
| 9. | West Falmouth | 7.8% | 2.8%(+4.99)#9 | 2.6%(+5.20)#1,528 |
| 10. | Siasconset | 7.7% | 2.8%(+4.93)#10 | 2.6%(+5.13)#1,549 |
| 11. | Groton | 7.6% | 2.8%(+4.87)#11 | 2.6%(+5.07)#1,581 |
| 12. | Dennis | 7.4% | 2.8%(+4.60)#12 | 2.6%(+4.80)#1,674 |
| 13. | East Dennis | 7.1% | 2.8%(+4.37)#13 | 2.6%(+4.58)#1,771 |
| 14. | Ayer | 6.8% | 2.8%(+4.06)#14 | 2.6%(+4.27)#1,933 |
| 15. | Lenox | 6.8% | 2.8%(+4.06)#15 | 2.6%(+4.26)#1,935 |
| 16. | West Brookfield | 6.6% | 2.8%(+3.82)#16 | 2.6%(+4.03)#2,049 |
| 17. | Shelburne Falls | 6.6% | 2.8%(+3.80)#17 | 2.6%(+4.01)#2,061 |
| 18. | Kingston | 6.4% | 2.8%(+3.67)#18 | 2.6%(+3.87)#2,142 |
| 19. | Amherst | 6.2% | 2.8%(+3.47)#19 | 2.6%(+3.68)#2,299 |
| 20. | Smith Mills | 6.2% | 2.8%(+3.43)#20 | 2.6%(+3.64)#2,328 |
| 21. | North Brookfield | 6.2% | 2.8%(+3.41)#21 | 2.6%(+3.61)#2,345 |
| 22. | Upton | 5.7% | 2.8%(+2.93)#22 | 2.6%(+3.13)#2,731 |
| 23. | Oak Bluffs | 5.7% | 2.8%(+2.90)#23 | 2.6%(+3.10)#2,765 |
| 24. | Essex | 5.6% | 2.8%(+2.80)#24 | 2.6%(+3.00)#2,848 |
| 25. | Holland | 5.5% | 2.8%(+2.76)#25 | 2.6%(+2.96)#2,896 |
| 26. | Bliss Corner | 5.4% | 2.8%(+2.63)#26 | 2.6%(+2.84)#3,011 |
| 27. | Fiskdale | 5.3% | 2.8%(+2.53)#27 | 2.6%(+2.73)#3,105 |
| 28. | Walpole | 5.2% | 2.8%(+2.48)#28 | 2.6%(+2.69)#3,163 |
| 29. | Chester | 5.0% | 2.8%(+2.26)#29 | 2.6%(+2.47)#3,419 |
| 30. | Housatonic | 5.0% | 2.8%(+2.25)#30 | 2.6%(+2.45)#3,437 |
| 31. | North Plymouth | 5.0% | 2.8%(+2.22)#31 | 2.6%(+2.43)#3,488 |
| 32. | Sharon | 5.0% | 2.8%(+2.22)#32 | 2.6%(+2.42)#3,500 |
| 33. | Harwich Center | 4.9% | 2.8%(+2.17)#33 | 2.6%(+2.37)#3,551 |
| 34. | Hanscom Afb | 4.9% | 2.8%(+2.15)#34 | 2.6%(+2.35)#3,579 |
| 35. | Northborough | 4.9% | 2.8%(+2.14)#35 | 2.6%(+2.35)#3,584 |
| 36. | Revere | 4.6% | 2.8%(+1.88)#36 | 2.6%(+2.08)#3,938 |
| 37. | Plymouth | 4.6% | 2.8%(+1.82)#37 | 2.6%(+2.02)#4,013 |
| 38. | Medfield | 4.6% | 2.8%(+1.82)#38 | 2.6%(+2.02)#4,016 |
| 39. | Randolph Town | 4.5% | 2.8%(+1.73)#39 | 2.6%(+1.93)#4,168 |
| 40. | South Yarmouth | 4.5% | 2.8%(+1.70)#40 | 2.6%(+1.91)#4,214 |
| 41. | North Adams | 4.5% | 2.8%(+1.70)#41 | 2.6%(+1.90)#4,218 |
| 42. | Framingham | 4.4% | 2.8%(+1.62)#42 | 2.6%(+1.82)#4,356 |
| 43. | Chatham | 4.3% | 2.8%(+1.56)#43 | 2.6%(+1.76)#4,444 |
| 44. | Middleborough Center | 4.3% | 2.8%(+1.51)#44 | 2.6%(+1.71)#4,519 |
| 45. | Turners Falls | 4.3% | 2.8%(+1.49)#45 | 2.6%(+1.69)#4,566 |
| 46. | Gardner | 4.2% | 2.8%(+1.44)#46 | 2.6%(+1.64)#4,663 |
| 47. | Orleans | 4.2% | 2.8%(+1.41)#47 | 2.6%(+1.61)#4,720 |
| 48. | Dedham | 4.0% | 2.8%(+1.26)#48 | 2.6%(+1.46)#4,994 |
| 49. | Hopedale | 4.0% | 2.8%(+1.24)#49 | 2.6%(+1.44)#5,031 |
| 50. | Salisbury | 4.0% | 2.8%(+1.22)#50 | 2.6%(+1.42)#5,091 |
| 51. | Whitinsville | 3.9% | 2.8%(+1.10)#51 | 2.6%(+1.30)#5,354 |
| 52. | North Scituate | 3.8% | 2.8%(+1.02)#52 | 2.6%(+1.22)#5,555 |
| 53. | Williamstown | 3.8% | 2.8%(+1.01)#53 | 2.6%(+1.21)#5,575 |
| 54. | Wilbraham | 3.7% | 2.8%(+0.980)#54 | 2.6%(+1.18)#5,655 |
| 55. | Woburn | 3.7% | 2.8%(+0.976)#55 | 2.6%(+1.18)#5,664 |
| 56. | Beverly | 3.7% | 2.8%(+0.976)#56 | 2.6%(+1.18)#5,665 |
| 57. | North Westport | 3.7% | 2.8%(+0.960)#57 | 2.6%(+1.16)#5,696 |
| 58. | Peabody | 3.7% | 2.8%(+0.946)#58 | 2.6%(+1.15)#5,730 |
| 59. | Everett | 3.7% | 2.8%(+0.943)#59 | 2.6%(+1.15)#5,733 |
| 60. | Scituate | 3.6% | 2.8%(+0.844)#60 | 2.6%(+1.05)#6,023 |
| 61. | Andover | 3.6% | 2.8%(+0.843)#61 | 2.6%(+1.04)#6,031 |
| 62. | Amesbury Town | 3.5% | 2.8%(+0.762)#62 | 2.6%(+0.964)#6,273 |
| 63. | Brockton | 3.5% | 2.8%(+0.761)#63 | 2.6%(+0.964)#6,274 |
| 64. | Barnstable Town | 3.5% | 2.8%(+0.740)#64 | 2.6%(+0.942)#6,337 |
| 65. | Bridgewater Town | 3.5% | 2.8%(+0.727)#65 | 2.6%(+0.929)#6,379 |
| 66. | Rutland | 3.5% | 2.8%(+0.700)#66 | 2.6%(+0.902)#6,451 |
| 67. | Worcester | 3.5% | 2.8%(+0.694)#67 | 2.6%(+0.897)#6,464 |
| 68. | Clinton | 3.5% | 2.8%(+0.693)#68 | 2.6%(+0.895)#6,474 |
| 69. | Nantucket | 3.4% | 2.8%(+0.660)#69 | 2.6%(+0.863)#6,569 |
| 70. | Lawrence | 3.4% | 2.8%(+0.655)#70 | 2.6%(+0.857)#6,586 |
| 71. | Quincy | 3.4% | 2.8%(+0.594)#71 | 2.6%(+0.797)#6,803 |
| 72. | Millers Falls | 3.4% | 2.8%(+0.593)#72 | 2.6%(+0.796)#6,804 |
| 73. | Winchester | 3.3% | 2.8%(+0.580)#73 | 2.6%(+0.782)#6,852 |
| 74. | The Pinehills | 3.3% | 2.8%(+0.532)#74 | 2.6%(+0.735)#7,004 |
| 75. | Attleboro | 3.3% | 2.8%(+0.519)#75 | 2.6%(+0.721)#7,044 |
| 76. | East Harwich | 3.3% | 2.8%(+0.513)#76 | 2.6%(+0.715)#7,069 |
| 77. | Pepperell | 3.3% | 2.8%(+0.493)#77 | 2.6%(+0.695)#7,139 |
| 78. | Chelsea | 3.2% | 2.8%(+0.475)#78 | 2.6%(+0.677)#7,191 |
| 79. | Stoneham | 3.2% | 2.8%(+0.473)#79 | 2.6%(+0.675)#7,201 |
| 80. | Dennis Port | 3.2% | 2.8%(+0.467)#80 | 2.6%(+0.670)#7,222 |
| 81. | Braintree Town | 3.2% | 2.8%(+0.426)#81 | 2.6%(+0.628)#7,359 |
| 82. | Adams | 3.1% | 2.8%(+0.374)#82 | 2.6%(+0.577)#7,540 |
| 83. | Salem | 3.1% | 2.8%(+0.365)#83 | 2.6%(+0.567)#7,573 |
| 84. | Bellingham | 3.1% | 2.8%(+0.358)#84 | 2.6%(+0.560)#7,609 |
| 85. | Springfield | 3.1% | 2.8%(+0.332)#85 | 2.6%(+0.534)#7,709 |
| 86. | Hingham | 3.1% | 2.8%(+0.310)#86 | 2.6%(+0.512)#7,798 |
| 87. | Franklin Town | 3.1% | 2.8%(+0.306)#87 | 2.6%(+0.509)#7,815 |
| 88. | Fall River | 3.1% | 2.8%(+0.295)#88 | 2.6%(+0.497)#7,861 |
| 89. | Newton | 3.0% | 2.8%(+0.281)#89 | 2.6%(+0.483)#7,916 |
| 90. | Holyoke | 3.0% | 2.8%(+0.265)#90 | 2.6%(+0.467)#7,984 |
| 91. | Norwood | 3.0% | 2.8%(+0.237)#91 | 2.6%(+0.439)#8,091 |
| 92. | Saugus | 3.0% | 2.8%(+0.213)#92 | 2.6%(+0.415)#8,178 |
| 93. | Oxford | 3.0% | 2.8%(+0.204)#93 | 2.6%(+0.406)#8,217 |
| 94. | Malden | 2.9% | 2.8%(+0.184)#94 | 2.6%(+0.387)#8,288 |
| 95. | West Dennis | 2.9% | 2.8%(+0.170)#95 | 2.6%(+0.373)#8,351 |
| 96. | Waltham | 2.9% | 2.8%(+0.169)#96 | 2.6%(+0.372)#8,355 |
| 97. | Boxford | 2.9% | 2.8%(+0.146)#97 | 2.6%(+0.348)#8,444 |
| 98. | Brewster | 2.9% | 2.8%(+0.123)#98 | 2.6%(+0.325)#8,546 |
| 99. | Lynn | 2.8% | 2.8%(+0.075)#99 | 2.6%(+0.278)#8,749 |
| 100. | Gloucester | 2.8% | 2.8%(+0.074)#100 | 2.6%(+0.277)#8,753 |
Common Questions
What are the Top 10 Cities with the Highest Percentage of Population Employed in Personal Care and Service in Massachusetts?
Top 10 Cities with the Highest Percentage of Population Employed in Personal Care and Service in Massachusetts are:
#1
15.9%
#2
14.8%
#3
10.4%
#4
10.2%
#5
9.7%
#6
8.3%
#7
8.0%
#8
7.8%
#9
7.7%
#10
7.6%
What city has the Highest Percentage of Population Employed in Personal Care and Service in Massachusetts?
Devens has the Highest Percentage of Population Employed in Personal Care and Service in Massachusetts with 15.9%.
What is the Percentage of Population Employed in Personal Care and Service in the State of Massachusetts?
Percentage of Population Employed in Personal Care and Service in Massachusetts is 2.8%.
What is the Percentage of Population Employed in Personal Care and Service in the United States?
Percentage of Population Employed in Personal Care and Service in the United States is 2.6%.