Cities with the Highest Percentage of Population Employed in Personal Care and Service in New York
RELATED REPORTS & OPTIONS
Personal Care and Service
New York
Compare Cities
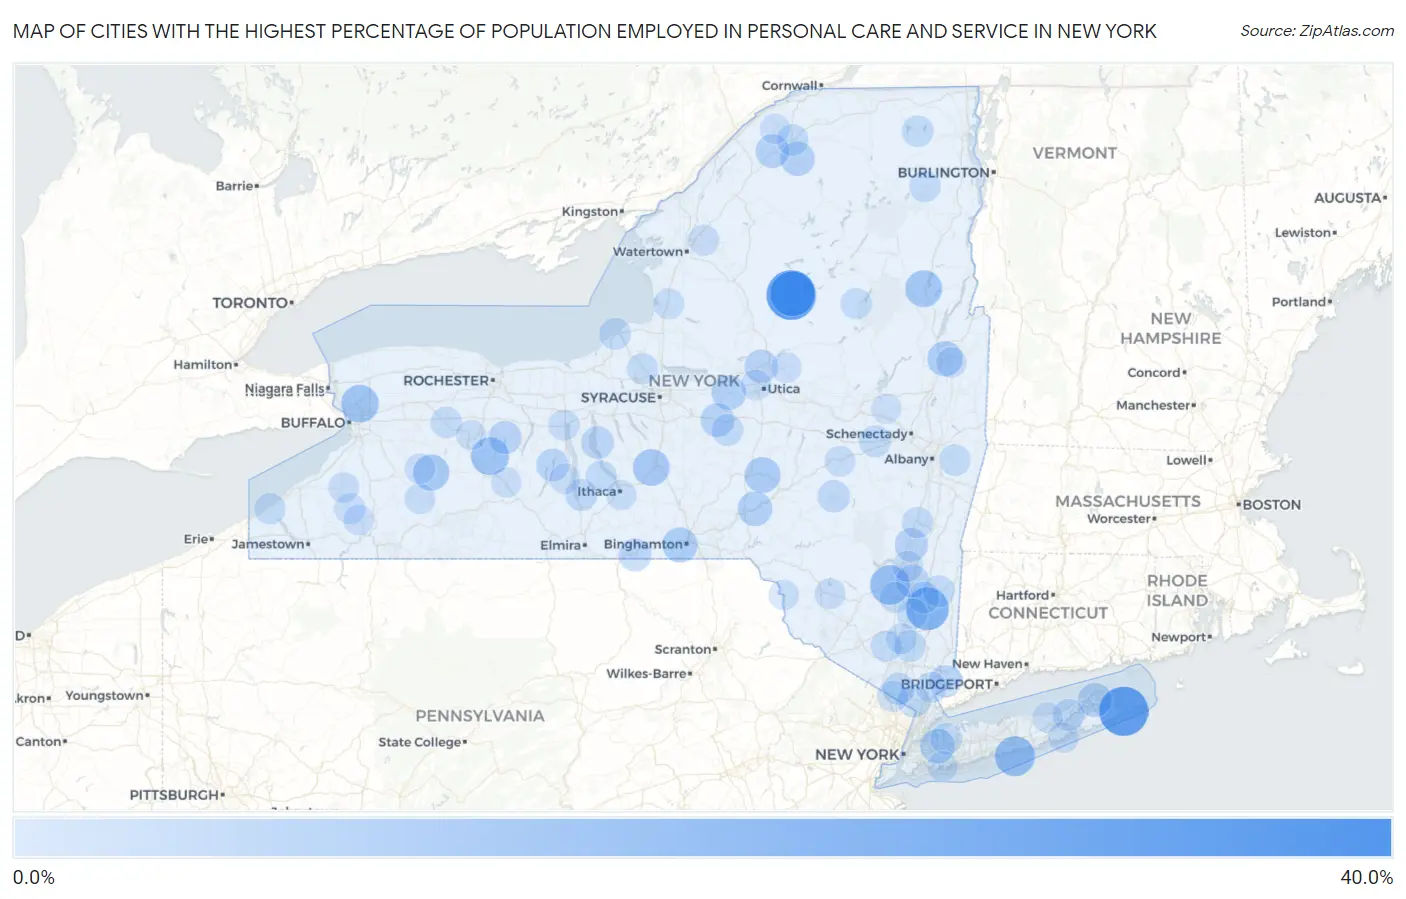
Map of Cities with the Highest Percentage of Population Employed in Personal Care and Service in New York
0.0%
40.0%
Cities with the Highest Percentage of Population Employed in Personal Care and Service in New York
| City | % Employed | vs State | vs National | |
| 1. | Bridgeville | 36.8% | 3.0%(+33.8)#1 | 2.6%(+34.2)#75 |
| 2. | Thendara | 31.7% | 3.0%(+28.7)#2 | 2.6%(+29.2)#105 |
| 3. | Napeague | 31.3% | 3.0%(+28.3)#3 | 2.6%(+28.8)#109 |
| 4. | North Bay | 27.1% | 3.0%(+24.1)#4 | 2.6%(+24.6)#137 |
| 5. | Old Forge | 25.7% | 3.0%(+22.7)#5 | 2.6%(+23.1)#153 |
| 6. | Westernville | 24.6% | 3.0%(+21.6)#6 | 2.6%(+22.0)#167 |
| 7. | Jefferson | 24.2% | 3.0%(+21.2)#7 | 2.6%(+21.6)#171 |
| 8. | Freedom Plains | 22.7% | 3.0%(+19.7)#8 | 2.6%(+20.2)#196 |
| 9. | Fire Island | 19.0% | 3.0%(+16.0)#9 | 2.6%(+16.5)#272 |
| 10. | High Falls | 18.6% | 3.0%(+15.6)#10 | 2.6%(+16.1)#281 |
| 11. | Siena College | 17.8% | 3.0%(+14.8)#11 | 2.6%(+15.3)#314 |
| 12. | Websters Crossing | 16.5% | 3.0%(+13.5)#12 | 2.6%(+13.9)#360 |
| 13. | University At Buffalo | 16.1% | 3.0%(+13.1)#13 | 2.6%(+13.6)#378 |
| 14. | Kiamesha Lake | 16.0% | 3.0%(+13.0)#14 | 2.6%(+13.5)#379 |
| 15. | Copake | 15.9% | 3.0%(+12.9)#15 | 2.6%(+13.3)#388 |
| 16. | Pottersville | 15.2% | 3.0%(+12.2)#16 | 2.6%(+12.6)#418 |
| 17. | Cortland West | 14.9% | 3.0%(+11.9)#17 | 2.6%(+12.3)#430 |
| 18. | Fairview Cdp Westchester County | 14.5% | 3.0%(+11.5)#18 | 2.6%(+11.9)#452 |
| 19. | Pike | 14.1% | 3.0%(+11.1)#19 | 2.6%(+11.5)#486 |
| 20. | Morris | 13.8% | 3.0%(+10.8)#20 | 2.6%(+11.2)#502 |
| 21. | St. John Fisher College | 13.4% | 3.0%(+10.4)#21 | 2.6%(+10.9)#529 |
| 22. | South Glens Falls | 13.1% | 3.0%(+10.1)#22 | 2.6%(+10.6)#547 |
| 23. | Binghamton University | 13.0% | 3.0%(+9.95)#23 | 2.6%(+10.4)#563 |
| 24. | Nazareth College | 12.4% | 3.0%(+9.39)#24 | 2.6%(+9.83)#621 |
| 25. | Vernon | 12.2% | 3.0%(+9.21)#25 | 2.6%(+9.66)#637 |
| 26. | Unadilla | 12.2% | 3.0%(+9.19)#26 | 2.6%(+9.63)#640 |
| 27. | Lake Success | 12.1% | 3.0%(+9.11)#27 | 2.6%(+9.55)#650 |
| 28. | Vassar College | 12.0% | 3.0%(+9.02)#28 | 2.6%(+9.46)#664 |
| 29. | Colton | 11.9% | 3.0%(+8.94)#29 | 2.6%(+9.38)#671 |
| 30. | Shelter Island Heights | 11.8% | 3.0%(+8.82)#30 | 2.6%(+9.26)#683 |
| 31. | Morrisville | 11.4% | 3.0%(+8.43)#31 | 2.6%(+8.88)#724 |
| 32. | Canton | 11.2% | 3.0%(+8.24)#32 | 2.6%(+8.69)#747 |
| 33. | Hamilton College | 10.9% | 3.0%(+7.87)#33 | 2.6%(+8.31)#800 |
| 34. | Malden On Hudson | 10.7% | 3.0%(+7.74)#34 | 2.6%(+8.18)#821 |
| 35. | Holland Patent | 10.7% | 3.0%(+7.73)#35 | 2.6%(+8.18)#822 |
| 36. | Staatsburg | 10.7% | 3.0%(+7.68)#36 | 2.6%(+8.12)#825 |
| 37. | Honeoye | 10.5% | 3.0%(+7.52)#37 | 2.6%(+7.96)#845 |
| 38. | Swan Lake | 10.3% | 3.0%(+7.30)#38 | 2.6%(+7.75)#872 |
| 39. | Grahamsville | 10.3% | 3.0%(+7.26)#39 | 2.6%(+7.71)#878 |
| 40. | Nichols | 9.9% | 3.0%(+6.90)#40 | 2.6%(+7.34)#945 |
| 41. | Aurora | 9.8% | 3.0%(+6.82)#41 | 2.6%(+7.27)#957 |
| 42. | Keuka Park | 9.8% | 3.0%(+6.81)#42 | 2.6%(+7.25)#961 |
| 43. | Bedford | 9.5% | 3.0%(+6.45)#43 | 2.6%(+6.89)#1,037 |
| 44. | Stamford | 9.4% | 3.0%(+6.43)#44 | 2.6%(+6.87)#1,044 |
| 45. | Greenville Cdp Greene County | 9.4% | 3.0%(+6.38)#45 | 2.6%(+6.83)#1,058 |
| 46. | Grand View On Hudson | 9.2% | 3.0%(+6.19)#46 | 2.6%(+6.63)#1,096 |
| 47. | Laurel | 9.1% | 3.0%(+6.10)#47 | 2.6%(+6.54)#1,115 |
| 48. | Burdett | 9.0% | 3.0%(+5.95)#48 | 2.6%(+6.39)#1,158 |
| 49. | New Hempstead | 8.9% | 3.0%(+5.94)#49 | 2.6%(+6.38)#1,161 |
| 50. | Esperance | 8.8% | 3.0%(+5.82)#50 | 2.6%(+6.26)#1,194 |
| 51. | Suny Oswego | 8.8% | 3.0%(+5.81)#51 | 2.6%(+6.26)#1,198 |
| 52. | Millbrook | 8.8% | 3.0%(+5.80)#52 | 2.6%(+6.24)#1,202 |
| 53. | Potsdam | 8.7% | 3.0%(+5.69)#53 | 2.6%(+6.14)#1,227 |
| 54. | Greenvale | 8.7% | 3.0%(+5.66)#54 | 2.6%(+6.10)#1,244 |
| 55. | Pleasant Valley | 8.7% | 3.0%(+5.65)#55 | 2.6%(+6.09)#1,246 |
| 56. | Hamilton | 8.6% | 3.0%(+5.64)#56 | 2.6%(+6.08)#1,249 |
| 57. | Burlington Flats | 8.6% | 3.0%(+5.60)#57 | 2.6%(+6.04)#1,258 |
| 58. | Nelsonville | 8.6% | 3.0%(+5.59)#58 | 2.6%(+6.03)#1,260 |
| 59. | Lyon Mountain | 8.6% | 3.0%(+5.57)#59 | 2.6%(+6.01)#1,270 |
| 60. | Marist College | 8.3% | 3.0%(+5.33)#60 | 2.6%(+5.77)#1,324 |
| 61. | Averill Park | 8.3% | 3.0%(+5.32)#61 | 2.6%(+5.76)#1,344 |
| 62. | Jefferson Heights | 8.3% | 3.0%(+5.30)#62 | 2.6%(+5.74)#1,347 |
| 63. | Wilmington | 8.3% | 3.0%(+5.28)#63 | 2.6%(+5.72)#1,349 |
| 64. | Washingtonville | 8.1% | 3.0%(+5.14)#64 | 2.6%(+5.58)#1,387 |
| 65. | Pavilion | 8.1% | 3.0%(+5.12)#65 | 2.6%(+5.57)#1,392 |
| 66. | Westfield | 8.1% | 3.0%(+5.09)#66 | 2.6%(+5.53)#1,406 |
| 67. | Airmont | 8.1% | 3.0%(+5.08)#67 | 2.6%(+5.53)#1,408 |
| 68. | Speculator | 8.1% | 3.0%(+5.07)#68 | 2.6%(+5.51)#1,411 |
| 69. | Trumansburg | 8.0% | 3.0%(+5.03)#69 | 2.6%(+5.47)#1,423 |
| 70. | Phoenix | 7.9% | 3.0%(+4.94)#70 | 2.6%(+5.39)#1,455 |
| 71. | New Paltz | 7.8% | 3.0%(+4.83)#71 | 2.6%(+5.27)#1,499 |
| 72. | Geneva | 7.8% | 3.0%(+4.82)#72 | 2.6%(+5.26)#1,502 |
| 73. | Crown Heights | 7.8% | 3.0%(+4.82)#73 | 2.6%(+5.26)#1,504 |
| 74. | East Kingston | 7.8% | 3.0%(+4.77)#74 | 2.6%(+5.22)#1,526 |
| 75. | Cattaraugus | 7.7% | 3.0%(+4.65)#75 | 2.6%(+5.10)#1,572 |
| 76. | Fort Drum | 7.6% | 3.0%(+4.63)#76 | 2.6%(+5.07)#1,578 |
| 77. | Loch Sheldrake | 7.6% | 3.0%(+4.59)#77 | 2.6%(+5.03)#1,595 |
| 78. | Richmondville | 7.6% | 3.0%(+4.57)#78 | 2.6%(+5.01)#1,601 |
| 79. | Milton Cdp Saratoga County | 7.6% | 3.0%(+4.57)#79 | 2.6%(+5.01)#1,605 |
| 80. | Chappaqua | 7.6% | 3.0%(+4.57)#80 | 2.6%(+5.01)#1,606 |
| 81. | Gowanda | 7.6% | 3.0%(+4.56)#81 | 2.6%(+5.00)#1,608 |
| 82. | Rushford | 7.6% | 3.0%(+4.55)#82 | 2.6%(+5.00)#1,613 |
| 83. | Lacona | 7.5% | 3.0%(+4.52)#83 | 2.6%(+4.96)#1,623 |
| 84. | New Windsor | 7.5% | 3.0%(+4.48)#84 | 2.6%(+4.92)#1,640 |
| 85. | Cold Brook | 7.3% | 3.0%(+4.27)#85 | 2.6%(+4.71)#1,705 |
| 86. | Little Valley | 7.3% | 3.0%(+4.26)#86 | 2.6%(+4.70)#1,709 |
| 87. | Whitesboro | 7.2% | 3.0%(+4.24)#87 | 2.6%(+4.68)#1,713 |
| 88. | Dundee | 7.2% | 3.0%(+4.18)#88 | 2.6%(+4.62)#1,740 |
| 89. | Quogue | 7.2% | 3.0%(+4.18)#89 | 2.6%(+4.62)#1,741 |
| 90. | Bliss | 7.1% | 3.0%(+4.14)#90 | 2.6%(+4.58)#1,759 |
| 91. | Madrid | 7.0% | 3.0%(+4.01)#91 | 2.6%(+4.45)#1,825 |
| 92. | Cohocton | 7.0% | 3.0%(+4.00)#92 | 2.6%(+4.44)#1,828 |
| 93. | Callicoon | 7.0% | 3.0%(+4.00)#93 | 2.6%(+4.44)#1,830 |
| 94. | South Hill | 7.0% | 3.0%(+3.97)#94 | 2.6%(+4.41)#1,842 |
| 95. | Fort Edward | 7.0% | 3.0%(+3.97)#95 | 2.6%(+4.41)#1,843 |
| 96. | Geneseo | 6.9% | 3.0%(+3.93)#96 | 2.6%(+4.38)#1,864 |
| 97. | Bay Park | 6.9% | 3.0%(+3.91)#97 | 2.6%(+4.35)#1,879 |
| 98. | Baiting Hollow | 6.8% | 3.0%(+3.83)#98 | 2.6%(+4.27)#1,929 |
| 99. | Stittville | 6.8% | 3.0%(+3.78)#99 | 2.6%(+4.22)#1,948 |
| 100. | Hagaman | 6.7% | 3.0%(+3.67)#100 | 2.6%(+4.12)#1,997 |
Common Questions
What are the Top 10 Cities with the Highest Percentage of Population Employed in Personal Care and Service in New York?
Top 10 Cities with the Highest Percentage of Population Employed in Personal Care and Service in New York are:
#1
31.7%
#2
31.3%
#3
25.7%
#4
22.7%
#5
19.0%
#6
18.6%
#7
16.5%
#8
16.1%
#9
15.2%
#10
14.9%
What city has the Highest Percentage of Population Employed in Personal Care and Service in New York?
Thendara has the Highest Percentage of Population Employed in Personal Care and Service in New York with 31.7%.
What is the Percentage of Population Employed in Personal Care and Service in the State of New York?
Percentage of Population Employed in Personal Care and Service in New York is 3.0%.
What is the Percentage of Population Employed in Personal Care and Service in the United States?
Percentage of Population Employed in Personal Care and Service in the United States is 2.6%.