Cities with the Highest Percentage of Population Employed in Personal Care and Service in Kentucky
RELATED REPORTS & OPTIONS
Personal Care and Service
Kentucky
Compare Cities
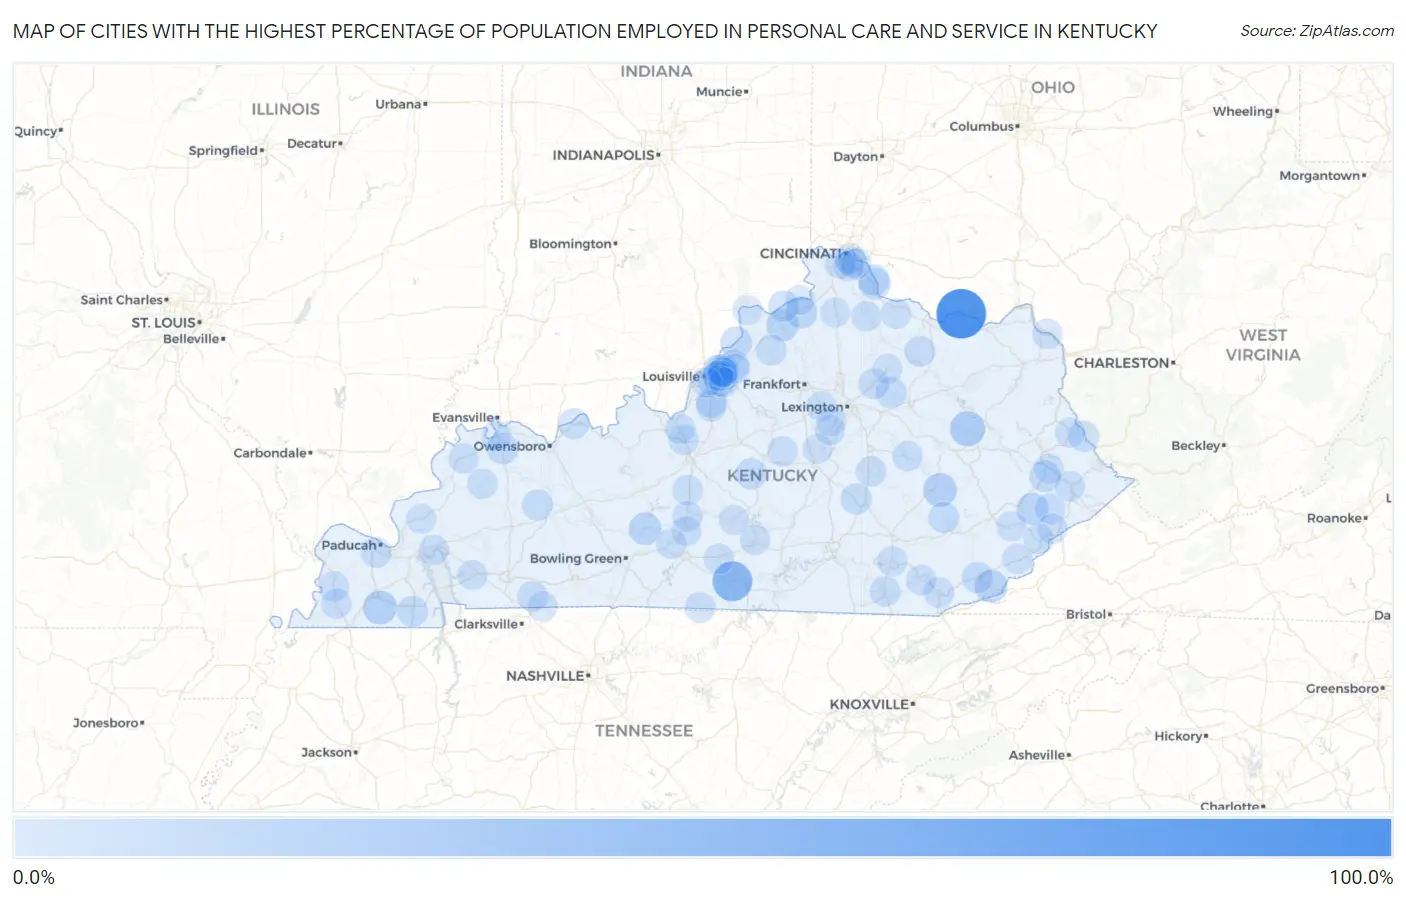
Map of Cities with the Highest Percentage of Population Employed in Personal Care and Service in Kentucky
0.0%
100.0%
Cities with the Highest Percentage of Population Employed in Personal Care and Service in Kentucky
| City | % Employed | vs State | vs National | |
| 1. | Concord | 100.0% | 2.3%(+97.7)#1 | 2.6%(+97.4)#9 |
| 2. | Marrowbone | 50.0% | 2.3%(+47.7)#2 | 2.6%(+47.4)#38 |
| 3. | Ezel | 26.6% | 2.3%(+24.3)#3 | 2.6%(+24.0)#145 |
| 4. | Sedalia | 21.4% | 2.3%(+19.1)#4 | 2.6%(+18.9)#224 |
| 5. | West Van Lear | 20.6% | 2.3%(+18.3)#5 | 2.6%(+18.0)#242 |
| 6. | Booneville | 19.3% | 2.3%(+17.0)#6 | 2.6%(+16.7)#265 |
| 7. | Cawood | 16.2% | 2.3%(+13.9)#7 | 2.6%(+13.6)#373 |
| 8. | Worthville | 15.1% | 2.3%(+12.8)#8 | 2.6%(+12.5)#422 |
| 9. | Brownsville | 15.1% | 2.3%(+12.7)#9 | 2.6%(+12.5)#423 |
| 10. | Moseleyville | 14.3% | 2.3%(+12.0)#10 | 2.6%(+11.7)#463 |
| 11. | Pippa Passes | 12.7% | 2.3%(+10.4)#11 | 2.6%(+10.2)#581 |
| 12. | Sparta | 12.3% | 2.3%(+9.97)#12 | 2.6%(+9.72)#631 |
| 13. | Westport | 11.1% | 2.3%(+8.80)#13 | 2.6%(+8.55)#771 |
| 14. | Martin | 10.9% | 2.3%(+8.55)#14 | 2.6%(+8.29)#804 |
| 15. | Mentor | 9.9% | 2.3%(+7.61)#15 | 2.6%(+7.35)#944 |
| 16. | Anthoston | 9.6% | 2.3%(+7.32)#16 | 2.6%(+7.07)#1,007 |
| 17. | Hills And Dales | 9.5% | 2.3%(+7.22)#17 | 2.6%(+6.96)#1,021 |
| 18. | St Mary | 9.2% | 2.3%(+6.90)#18 | 2.6%(+6.65)#1,092 |
| 19. | Murray | 9.1% | 2.3%(+6.80)#19 | 2.6%(+6.54)#1,116 |
| 20. | North Middletown | 9.0% | 2.3%(+6.67)#20 | 2.6%(+6.42)#1,152 |
| 21. | Brodhead | 8.9% | 2.3%(+6.59)#21 | 2.6%(+6.34)#1,171 |
| 22. | Loyall | 8.5% | 2.3%(+6.22)#22 | 2.6%(+5.96)#1,283 |
| 23. | Stanley | 8.1% | 2.3%(+5.80)#23 | 2.6%(+5.55)#1,402 |
| 24. | Ghent | 8.1% | 2.3%(+5.77)#24 | 2.6%(+5.51)#1,412 |
| 25. | California | 7.9% | 2.3%(+5.59)#25 | 2.6%(+5.33)#1,476 |
| 26. | Oneida | 7.7% | 2.3%(+5.39)#26 | 2.6%(+5.13)#1,545 |
| 27. | Warfield | 7.7% | 2.3%(+5.39)#27 | 2.6%(+5.13)#1,546 |
| 28. | Broeck Pointe | 7.6% | 2.3%(+5.33)#28 | 2.6%(+5.07)#1,579 |
| 29. | Bremen | 7.4% | 2.3%(+5.10)#29 | 2.6%(+4.84)#1,659 |
| 30. | New Castle | 7.3% | 2.3%(+4.94)#30 | 2.6%(+4.69)#1,712 |
| 31. | Ewing | 6.9% | 2.3%(+4.62)#31 | 2.6%(+4.37)#1,867 |
| 32. | Williamsburg | 6.9% | 2.3%(+4.60)#32 | 2.6%(+4.35)#1,881 |
| 33. | Lewisport | 6.9% | 2.3%(+4.59)#33 | 2.6%(+4.34)#1,888 |
| 34. | Spring Valley | 6.8% | 2.3%(+4.53)#34 | 2.6%(+4.27)#1,930 |
| 35. | Paris | 6.7% | 2.3%(+4.44)#35 | 2.6%(+4.18)#1,965 |
| 36. | Fox Chase | 6.7% | 2.3%(+4.40)#36 | 2.6%(+4.15)#1,985 |
| 37. | Hendron | 6.6% | 2.3%(+4.33)#37 | 2.6%(+4.07)#2,020 |
| 38. | Hunters Hollow | 6.5% | 2.3%(+4.16)#38 | 2.6%(+3.91)#2,120 |
| 39. | Southgate | 6.3% | 2.3%(+4.02)#39 | 2.6%(+3.76)#2,220 |
| 40. | Trenton | 6.3% | 2.3%(+3.98)#40 | 2.6%(+3.73)#2,250 |
| 41. | Crestwood | 6.0% | 2.3%(+3.69)#41 | 2.6%(+3.44)#2,464 |
| 42. | Lincolnshire | 6.0% | 2.3%(+3.69)#42 | 2.6%(+3.44)#2,471 |
| 43. | Gamaliel | 5.9% | 2.3%(+3.64)#43 | 2.6%(+3.38)#2,505 |
| 44. | Pineville | 5.7% | 2.3%(+3.44)#44 | 2.6%(+3.18)#2,695 |
| 45. | Seneca Gardens | 5.6% | 2.3%(+3.27)#45 | 2.6%(+3.01)#2,843 |
| 46. | Sorgho | 5.6% | 2.3%(+3.25)#46 | 2.6%(+2.99)#2,854 |
| 47. | Upton | 5.6% | 2.3%(+3.25)#47 | 2.6%(+2.99)#2,860 |
| 48. | Wheelwright | 5.5% | 2.3%(+3.22)#48 | 2.6%(+2.96)#2,899 |
| 49. | Crestview | 5.5% | 2.3%(+3.16)#49 | 2.6%(+2.91)#2,945 |
| 50. | Arlington | 5.4% | 2.3%(+3.13)#50 | 2.6%(+2.87)#2,976 |
| 51. | Irvine | 5.3% | 2.3%(+2.96)#51 | 2.6%(+2.71)#3,132 |
| 52. | Mackville | 5.2% | 2.3%(+2.91)#52 | 2.6%(+2.65)#3,198 |
| 53. | Fleming Neon | 5.2% | 2.3%(+2.91)#53 | 2.6%(+2.65)#3,206 |
| 54. | Kuttawa | 5.2% | 2.3%(+2.88)#54 | 2.6%(+2.62)#3,224 |
| 55. | Bellemeade | 5.2% | 2.3%(+2.85)#55 | 2.6%(+2.59)#3,255 |
| 56. | Columbia | 5.1% | 2.3%(+2.83)#56 | 2.6%(+2.57)#3,279 |
| 57. | Langdon Place | 5.1% | 2.3%(+2.83)#57 | 2.6%(+2.57)#3,281 |
| 58. | Edmonton | 5.1% | 2.3%(+2.83)#58 | 2.6%(+2.57)#3,282 |
| 59. | Munfordville | 5.0% | 2.3%(+2.73)#59 | 2.6%(+2.47)#3,404 |
| 60. | Worthington | 5.0% | 2.3%(+2.71)#60 | 2.6%(+2.46)#3,430 |
| 61. | Clinton | 5.0% | 2.3%(+2.71)#61 | 2.6%(+2.45)#3,433 |
| 62. | Woodlawn Park | 4.9% | 2.3%(+2.58)#62 | 2.6%(+2.33)#3,604 |
| 63. | Berea | 4.8% | 2.3%(+2.54)#63 | 2.6%(+2.28)#3,670 |
| 64. | Radcliff | 4.8% | 2.3%(+2.47)#64 | 2.6%(+2.22)#3,742 |
| 65. | Fort Knox | 4.7% | 2.3%(+2.44)#65 | 2.6%(+2.18)#3,789 |
| 66. | Artemus | 4.7% | 2.3%(+2.43)#66 | 2.6%(+2.17)#3,808 |
| 67. | Whitesburg | 4.6% | 2.3%(+2.30)#67 | 2.6%(+2.05)#3,985 |
| 68. | Falmouth | 4.6% | 2.3%(+2.27)#68 | 2.6%(+2.02)#4,025 |
| 69. | Dixon | 4.6% | 2.3%(+2.25)#69 | 2.6%(+2.00)#4,066 |
| 70. | Park City | 4.5% | 2.3%(+2.23)#70 | 2.6%(+1.97)#4,120 |
| 71. | Breckinridge Center | 4.5% | 2.3%(+2.22)#71 | 2.6%(+1.97)#4,123 |
| 72. | Cadiz | 4.5% | 2.3%(+2.17)#72 | 2.6%(+1.91)#4,204 |
| 73. | Pewee Valley | 4.5% | 2.3%(+2.15)#73 | 2.6%(+1.90)#4,225 |
| 74. | Pikeville | 4.5% | 2.3%(+2.15)#74 | 2.6%(+1.90)#4,231 |
| 75. | Burgin | 4.4% | 2.3%(+2.14)#75 | 2.6%(+1.89)#4,238 |
| 76. | Crestview Hills | 4.4% | 2.3%(+2.14)#76 | 2.6%(+1.89)#4,242 |
| 77. | Inez | 4.4% | 2.3%(+2.11)#77 | 2.6%(+1.85)#4,309 |
| 78. | Guthrie | 4.4% | 2.3%(+2.08)#78 | 2.6%(+1.83)#4,342 |
| 79. | Parkway Village | 4.4% | 2.3%(+2.07)#79 | 2.6%(+1.82)#4,353 |
| 80. | Horse Cave | 4.4% | 2.3%(+2.06)#80 | 2.6%(+1.81)#4,373 |
| 81. | Vicco | 4.3% | 2.3%(+2.04)#81 | 2.6%(+1.79)#4,408 |
| 82. | Warsaw | 4.3% | 2.3%(+1.97)#82 | 2.6%(+1.72)#4,513 |
| 83. | Highland Heights | 4.2% | 2.3%(+1.88)#83 | 2.6%(+1.63)#4,689 |
| 84. | North Corbin | 4.2% | 2.3%(+1.88)#84 | 2.6%(+1.62)#4,692 |
| 85. | Versailles | 4.1% | 2.3%(+1.79)#85 | 2.6%(+1.53)#4,871 |
| 86. | Richlawn | 4.1% | 2.3%(+1.78)#86 | 2.6%(+1.53)#4,874 |
| 87. | Wilmore | 4.0% | 2.3%(+1.73)#87 | 2.6%(+1.47)#4,979 |
| 88. | Forest Hills | 4.0% | 2.3%(+1.71)#88 | 2.6%(+1.46)#5,009 |
| 89. | Millersburg | 3.9% | 2.3%(+1.57)#89 | 2.6%(+1.32)#5,321 |
| 90. | Keene | 3.8% | 2.3%(+1.52)#90 | 2.6%(+1.27)#5,455 |
| 91. | Cumberland | 3.8% | 2.3%(+1.52)#91 | 2.6%(+1.26)#5,463 |
| 92. | Salem | 3.8% | 2.3%(+1.50)#92 | 2.6%(+1.25)#5,489 |
| 93. | Brooksville | 3.8% | 2.3%(+1.48)#93 | 2.6%(+1.23)#5,541 |
| 94. | Milton | 3.8% | 2.3%(+1.48)#94 | 2.6%(+1.22)#5,551 |
| 95. | Taylor Mill | 3.8% | 2.3%(+1.48)#95 | 2.6%(+1.22)#5,553 |
| 96. | Greensburg | 3.8% | 2.3%(+1.45)#96 | 2.6%(+1.20)#5,610 |
| 97. | Dry Ridge | 3.7% | 2.3%(+1.41)#97 | 2.6%(+1.15)#5,726 |
| 98. | Allen | 3.7% | 2.3%(+1.40)#98 | 2.6%(+1.14)#5,757 |
| 99. | Plantation | 3.7% | 2.3%(+1.39)#99 | 2.6%(+1.13)#5,781 |
| 100. | Henderson | 3.6% | 2.3%(+1.34)#100 | 2.6%(+1.08)#5,915 |
Common Questions
What are the Top 10 Cities with the Highest Percentage of Population Employed in Personal Care and Service in Kentucky?
Top 10 Cities with the Highest Percentage of Population Employed in Personal Care and Service in Kentucky are:
#1
100.0%
#2
50.0%
#3
26.6%
#4
21.4%
#5
19.3%
#6
16.2%
#7
15.1%
#8
15.1%
#9
12.7%
#10
12.3%
What city has the Highest Percentage of Population Employed in Personal Care and Service in Kentucky?
Concord has the Highest Percentage of Population Employed in Personal Care and Service in Kentucky with 100.0%.
What is the Percentage of Population Employed in Personal Care and Service in the State of Kentucky?
Percentage of Population Employed in Personal Care and Service in Kentucky is 2.3%.
What is the Percentage of Population Employed in Personal Care and Service in the United States?
Percentage of Population Employed in Personal Care and Service in the United States is 2.6%.