Cities with the Highest Percentage of Population Employed in Personal Care and Service in Oregon
RELATED REPORTS & OPTIONS
Personal Care and Service
Oregon
Compare Cities
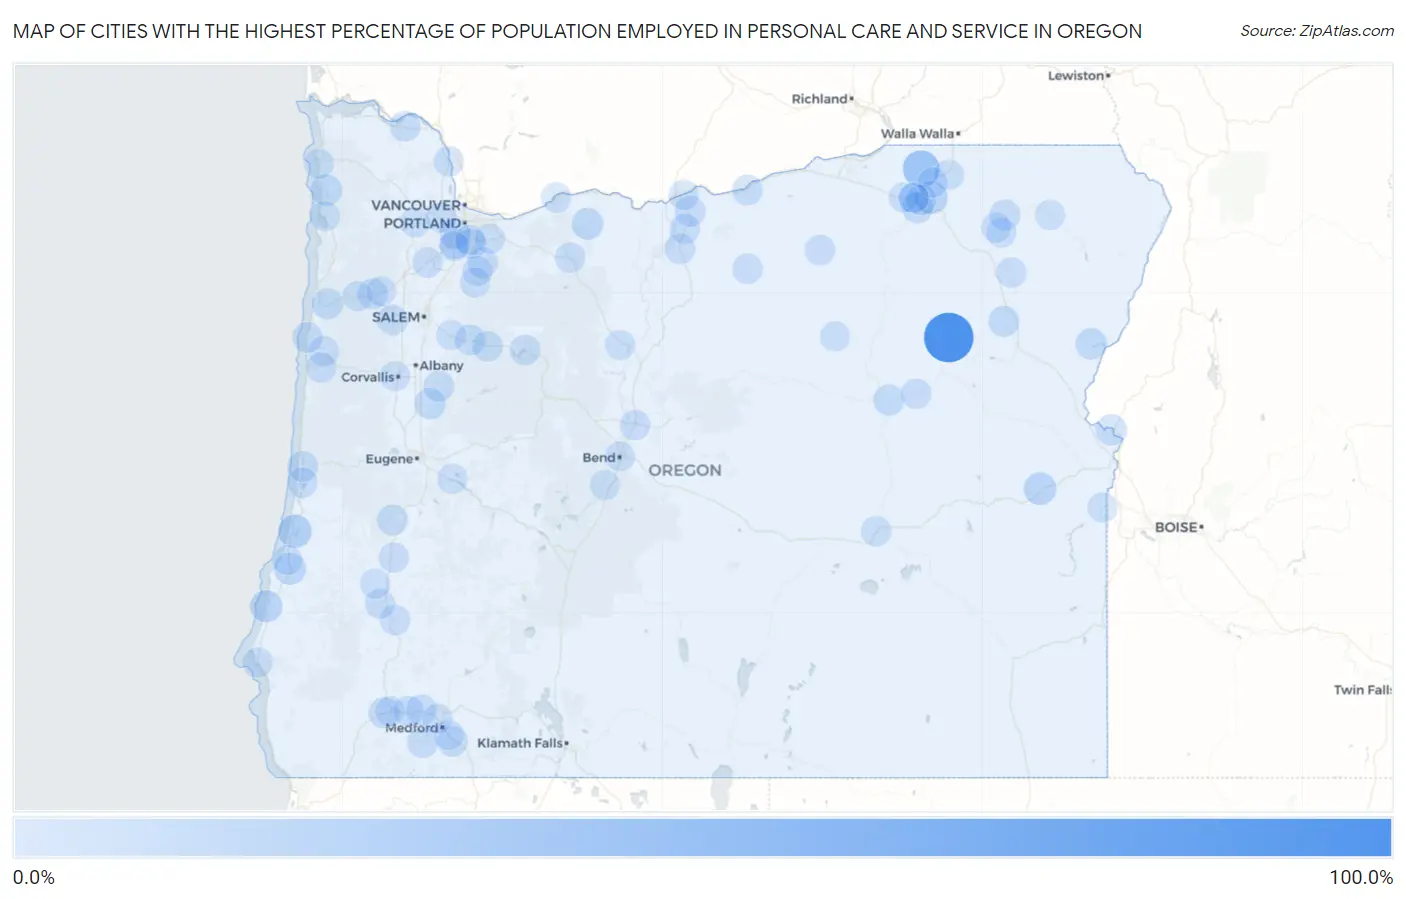
Map of Cities with the Highest Percentage of Population Employed in Personal Care and Service in Oregon
0.0%
100.0%
Cities with the Highest Percentage of Population Employed in Personal Care and Service in Oregon
| City | % Employed | vs State | vs National | |
| 1. | Granite | 100.0% | 2.4%(+97.6)#1 | 2.6%(+97.4)#11 |
| 2. | Helix | 34.9% | 2.4%(+32.5)#2 | 2.6%(+32.3)#88 |
| 3. | Lakeside | 18.7% | 2.4%(+16.3)#3 | 2.6%(+16.2)#279 |
| 4. | Beaver Marsh | 17.3% | 2.4%(+14.9)#4 | 2.6%(+14.7)#325 |
| 5. | Cayuse | 15.8% | 2.4%(+13.4)#5 | 2.6%(+13.2)#395 |
| 6. | Harper | 14.3% | 2.4%(+11.9)#6 | 2.6%(+11.7)#465 |
| 7. | Bandon | 12.4% | 2.4%(+10.1)#7 | 2.6%(+9.87)#616 |
| 8. | Mckay | 12.3% | 2.4%(+9.93)#8 | 2.6%(+9.75)#630 |
| 9. | Running Y Ranch | 12.0% | 2.4%(+9.58)#9 | 2.6%(+9.39)#669 |
| 10. | Bunker Hill | 11.7% | 2.4%(+9.30)#10 | 2.6%(+9.11)#694 |
| 11. | Parkdale | 11.0% | 2.4%(+8.63)#11 | 2.6%(+8.44)#786 |
| 12. | Nehalem | 10.2% | 2.4%(+7.78)#12 | 2.6%(+7.59)#904 |
| 13. | Richland | 9.8% | 2.4%(+7.38)#13 | 2.6%(+7.19)#978 |
| 14. | Barnesdale | 9.7% | 2.4%(+7.30)#14 | 2.6%(+7.11)#991 |
| 15. | Falcon Heights | 9.5% | 2.4%(+7.14)#15 | 2.6%(+6.95)#1,030 |
| 16. | Annex | 8.3% | 2.4%(+5.91)#16 | 2.6%(+5.72)#1,351 |
| 17. | Tutuilla | 8.1% | 2.4%(+5.75)#17 | 2.6%(+5.56)#1,394 |
| 18. | Boring | 8.0% | 2.4%(+5.61)#18 | 2.6%(+5.42)#1,442 |
| 19. | Rose Lodge | 7.9% | 2.4%(+5.52)#19 | 2.6%(+5.33)#1,478 |
| 20. | Brownsville | 7.6% | 2.4%(+5.19)#20 | 2.6%(+5.00)#1,611 |
| 21. | John Day | 7.5% | 2.4%(+5.16)#21 | 2.6%(+4.98)#1,620 |
| 22. | Cherry Grove | 7.2% | 2.4%(+4.81)#22 | 2.6%(+4.62)#1,743 |
| 23. | Haines | 7.1% | 2.4%(+4.77)#23 | 2.6%(+4.58)#1,764 |
| 24. | Redwood | 7.1% | 2.4%(+4.69)#24 | 2.6%(+4.51)#1,796 |
| 25. | Drain | 6.9% | 2.4%(+4.54)#25 | 2.6%(+4.36)#1,875 |
| 26. | Gold Hill | 6.7% | 2.4%(+4.36)#26 | 2.6%(+4.17)#1,974 |
| 27. | Talent | 6.7% | 2.4%(+4.31)#27 | 2.6%(+4.13)#1,993 |
| 28. | Elgin | 6.6% | 2.4%(+4.22)#28 | 2.6%(+4.03)#2,044 |
| 29. | South Lebanon | 6.3% | 2.4%(+3.96)#29 | 2.6%(+3.77)#2,210 |
| 30. | Dallas | 6.3% | 2.4%(+3.95)#30 | 2.6%(+3.76)#2,217 |
| 31. | Mehama | 6.3% | 2.4%(+3.90)#31 | 2.6%(+3.71)#2,266 |
| 32. | Wasco | 6.2% | 2.4%(+3.88)#32 | 2.6%(+3.69)#2,283 |
| 33. | Willamina | 6.2% | 2.4%(+3.83)#33 | 2.6%(+3.64)#2,324 |
| 34. | Beavercreek | 6.1% | 2.4%(+3.70)#34 | 2.6%(+3.51)#2,417 |
| 35. | Florence | 5.9% | 2.4%(+3.54)#35 | 2.6%(+3.35)#2,531 |
| 36. | Arlington | 5.9% | 2.4%(+3.51)#36 | 2.6%(+3.32)#2,552 |
| 37. | Ruch | 5.9% | 2.4%(+3.49)#37 | 2.6%(+3.30)#2,578 |
| 38. | Mill City | 5.8% | 2.4%(+3.42)#38 | 2.6%(+3.23)#2,652 |
| 39. | Clatskanie | 5.6% | 2.4%(+3.26)#39 | 2.6%(+3.07)#2,798 |
| 40. | Metzger | 5.6% | 2.4%(+3.21)#40 | 2.6%(+3.02)#2,839 |
| 41. | Rockcreek | 5.4% | 2.4%(+3.07)#41 | 2.6%(+2.88)#2,965 |
| 42. | Heppner | 5.4% | 2.4%(+3.02)#42 | 2.6%(+2.83)#3,014 |
| 43. | Myrtle Creek | 5.4% | 2.4%(+3.01)#43 | 2.6%(+2.82)#3,031 |
| 44. | Marlene | 5.3% | 2.4%(+2.91)#44 | 2.6%(+2.72)#3,118 |
| 45. | Dunes City | 5.2% | 2.4%(+2.85)#45 | 2.6%(+2.66)#3,188 |
| 46. | Condon | 5.1% | 2.4%(+2.75)#46 | 2.6%(+2.57)#3,286 |
| 47. | Grass Valley | 5.0% | 2.4%(+2.63)#47 | 2.6%(+2.44)#3,462 |
| 48. | Detroit | 5.0% | 2.4%(+2.63)#48 | 2.6%(+2.44)#3,474 |
| 49. | Rogue River | 4.9% | 2.4%(+2.50)#49 | 2.6%(+2.32)#3,611 |
| 50. | Siletz | 4.6% | 2.4%(+2.26)#50 | 2.6%(+2.08)#3,942 |
| 51. | Prairie City | 4.6% | 2.4%(+2.26)#51 | 2.6%(+2.07)#3,950 |
| 52. | Depoe Bay | 4.6% | 2.4%(+2.26)#52 | 2.6%(+2.07)#3,953 |
| 53. | Moro | 4.6% | 2.4%(+2.20)#53 | 2.6%(+2.01)#4,037 |
| 54. | Dundee | 4.6% | 2.4%(+2.20)#54 | 2.6%(+2.01)#4,039 |
| 55. | Jennings Lodge | 4.3% | 2.4%(+1.97)#55 | 2.6%(+1.78)#4,424 |
| 56. | Molalla | 4.3% | 2.4%(+1.93)#56 | 2.6%(+1.75)#4,467 |
| 57. | Government Camp | 4.3% | 2.4%(+1.88)#57 | 2.6%(+1.69)#4,560 |
| 58. | Weston | 4.2% | 2.4%(+1.86)#58 | 2.6%(+1.67)#4,600 |
| 59. | Columbia City | 4.2% | 2.4%(+1.82)#59 | 2.6%(+1.64)#4,671 |
| 60. | Gopher Flats | 4.2% | 2.4%(+1.82)#60 | 2.6%(+1.63)#4,679 |
| 61. | Burns | 4.2% | 2.4%(+1.82)#61 | 2.6%(+1.63)#4,683 |
| 62. | Redmond | 4.1% | 2.4%(+1.72)#62 | 2.6%(+1.53)#4,862 |
| 63. | Toledo | 4.1% | 2.4%(+1.70)#63 | 2.6%(+1.51)#4,915 |
| 64. | Mission | 4.1% | 2.4%(+1.68)#64 | 2.6%(+1.49)#4,953 |
| 65. | Durham | 4.0% | 2.4%(+1.66)#65 | 2.6%(+1.47)#4,975 |
| 66. | River Road | 4.0% | 2.4%(+1.64)#66 | 2.6%(+1.46)#5,006 |
| 67. | Union | 4.0% | 2.4%(+1.63)#67 | 2.6%(+1.44)#5,030 |
| 68. | Port Orford | 4.0% | 2.4%(+1.63)#68 | 2.6%(+1.44)#5,041 |
| 69. | Winston | 3.9% | 2.4%(+1.57)#69 | 2.6%(+1.38)#5,171 |
| 70. | Rufus | 3.9% | 2.4%(+1.52)#70 | 2.6%(+1.33)#5,287 |
| 71. | Oakland | 3.9% | 2.4%(+1.50)#71 | 2.6%(+1.31)#5,334 |
| 72. | Phoenix | 3.9% | 2.4%(+1.48)#72 | 2.6%(+1.29)#5,382 |
| 73. | Warm Springs | 3.8% | 2.4%(+1.47)#73 | 2.6%(+1.28)#5,416 |
| 74. | Mulino | 3.8% | 2.4%(+1.38)#74 | 2.6%(+1.19)#5,629 |
| 75. | Garibaldi | 3.7% | 2.4%(+1.33)#75 | 2.6%(+1.14)#5,745 |
| 76. | Melrose | 3.7% | 2.4%(+1.32)#76 | 2.6%(+1.13)#5,784 |
| 77. | Damascus | 3.6% | 2.4%(+1.22)#77 | 2.6%(+1.04)#6,060 |
| 78. | Oak Grove | 3.6% | 2.4%(+1.18)#78 | 2.6%(+0.995)#6,181 |
| 79. | Adams | 3.6% | 2.4%(+1.18)#79 | 2.6%(+0.988)#6,205 |
| 80. | North Bend | 3.5% | 2.4%(+1.12)#80 | 2.6%(+0.928)#6,384 |
| 81. | Pendleton | 3.5% | 2.4%(+1.09)#81 | 2.6%(+0.899)#6,461 |
| 82. | Imbler | 3.4% | 2.4%(+1.07)#82 | 2.6%(+0.886)#6,503 |
| 83. | Cascade Locks | 3.4% | 2.4%(+1.06)#83 | 2.6%(+0.872)#6,544 |
| 84. | Summerville | 3.4% | 2.4%(+1.02)#84 | 2.6%(+0.827)#6,701 |
| 85. | Grand Ronde | 3.4% | 2.4%(+0.981)#85 | 2.6%(+0.793)#6,812 |
| 86. | Bend | 3.3% | 2.4%(+0.914)#86 | 2.6%(+0.726)#7,027 |
| 87. | Monument | 3.3% | 2.4%(+0.904)#87 | 2.6%(+0.716)#7,066 |
| 88. | Central Point | 3.3% | 2.4%(+0.900)#88 | 2.6%(+0.712)#7,077 |
| 89. | Cannon Beach | 3.3% | 2.4%(+0.888)#89 | 2.6%(+0.700)#7,123 |
| 90. | Adrian | 3.2% | 2.4%(+0.851)#90 | 2.6%(+0.663)#7,253 |
| 91. | Wallowa | 3.2% | 2.4%(+0.790)#91 | 2.6%(+0.602)#7,450 |
| 92. | Grants Pass | 3.2% | 2.4%(+0.781)#92 | 2.6%(+0.593)#7,481 |
| 93. | Forest Grove | 3.1% | 2.4%(+0.771)#93 | 2.6%(+0.583)#7,521 |
| 94. | Sublimity | 3.1% | 2.4%(+0.769)#94 | 2.6%(+0.581)#7,529 |
| 95. | Sunriver | 3.1% | 2.4%(+0.744)#95 | 2.6%(+0.556)#7,621 |
| 96. | Riverside | 3.1% | 2.4%(+0.734)#96 | 2.6%(+0.546)#7,659 |
| 97. | Lowell | 3.1% | 2.4%(+0.726)#97 | 2.6%(+0.538)#7,682 |
| 98. | Corvallis | 3.1% | 2.4%(+0.714)#98 | 2.6%(+0.526)#7,736 |
| 99. | Tualatin | 3.0% | 2.4%(+0.671)#99 | 2.6%(+0.483)#7,917 |
| 100. | Sheridan | 3.0% | 2.4%(+0.671)#100 | 2.6%(+0.483)#7,919 |
Common Questions
What are the Top 10 Cities with the Highest Percentage of Population Employed in Personal Care and Service in Oregon?
Top 10 Cities with the Highest Percentage of Population Employed in Personal Care and Service in Oregon are:
What city has the Highest Percentage of Population Employed in Personal Care and Service in Oregon?
Granite has the Highest Percentage of Population Employed in Personal Care and Service in Oregon with 100.0%.
What is the Percentage of Population Employed in Personal Care and Service in the State of Oregon?
Percentage of Population Employed in Personal Care and Service in Oregon is 2.4%.
What is the Percentage of Population Employed in Personal Care and Service in the United States?
Percentage of Population Employed in Personal Care and Service in the United States is 2.6%.