Cities with the Highest Percentage of Population Employed in Personal Care and Service in Tennessee
RELATED REPORTS & OPTIONS
Personal Care and Service
Tennessee
Compare Cities
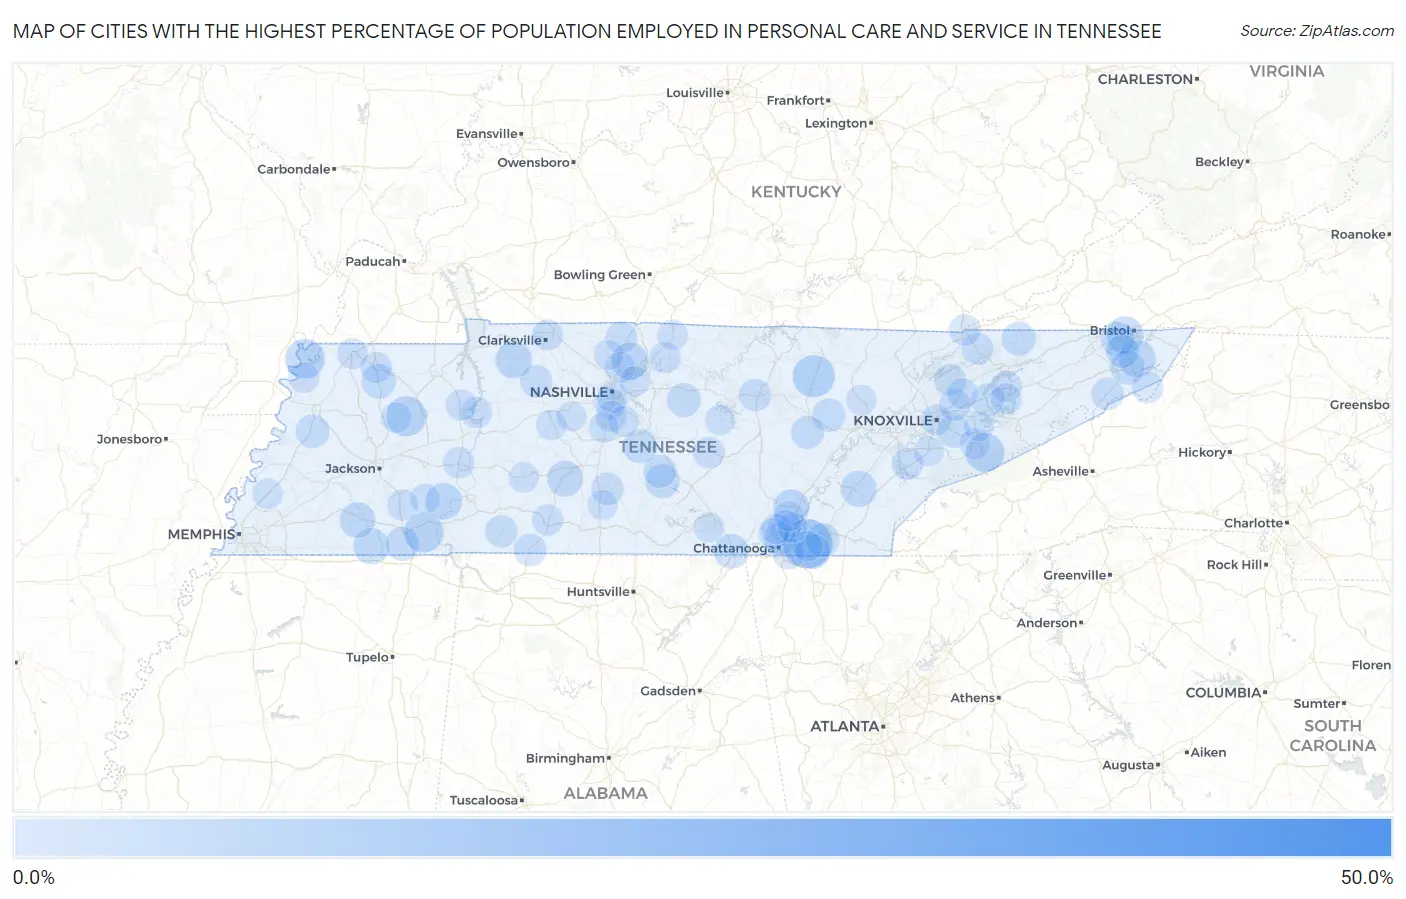
Map of Cities with the Highest Percentage of Population Employed in Personal Care and Service in Tennessee
0.0%
50.0%
Cities with the Highest Percentage of Population Employed in Personal Care and Service in Tennessee
| City | % Employed | vs State | vs National | |
| 1. | Dukedom | 42.9% | 2.2%(+40.6)#1 | 2.6%(+40.3)#58 |
| 2. | Randolph | 23.1% | 2.2%(+20.9)#2 | 2.6%(+20.5)#188 |
| 3. | Ooltewah | 14.8% | 2.2%(+12.5)#3 | 2.6%(+12.2)#440 |
| 4. | Grimsley | 10.2% | 2.2%(+8.01)#4 | 2.6%(+7.67)#889 |
| 5. | Cosby | 9.8% | 2.2%(+7.61)#5 | 2.6%(+7.27)#956 |
| 6. | Mclemoresville | 9.0% | 2.2%(+6.74)#6 | 2.6%(+6.40)#1,157 |
| 7. | Stantonville | 8.6% | 2.2%(+6.38)#7 | 2.6%(+6.05)#1,255 |
| 8. | Tiptonville | 8.5% | 2.2%(+6.28)#8 | 2.6%(+5.95)#1,287 |
| 9. | Gatlinburg | 8.0% | 2.2%(+5.77)#9 | 2.6%(+5.44)#1,433 |
| 10. | Shackle Island | 7.0% | 2.2%(+4.79)#10 | 2.6%(+4.45)#1,823 |
| 11. | Walnut Hill | 7.0% | 2.2%(+4.73)#11 | 2.6%(+4.39)#1,856 |
| 12. | Orebank | 6.9% | 2.2%(+4.68)#12 | 2.6%(+4.34)#1,887 |
| 13. | Hilham | 6.9% | 2.2%(+4.65)#13 | 2.6%(+4.31)#1,902 |
| 14. | Hunter | 6.8% | 2.2%(+4.56)#14 | 2.6%(+4.22)#1,949 |
| 15. | Cumberland City | 6.7% | 2.2%(+4.50)#15 | 2.6%(+4.17)#1,975 |
| 16. | Saltillo | 6.7% | 2.2%(+4.44)#16 | 2.6%(+4.10)#2,001 |
| 17. | Bon Air | 6.6% | 2.2%(+4.34)#17 | 2.6%(+4.01)#2,058 |
| 18. | Flat Top Mountain | 6.4% | 2.2%(+4.21)#18 | 2.6%(+3.88)#2,140 |
| 19. | Middleton | 6.4% | 2.2%(+4.14)#19 | 2.6%(+3.81)#2,186 |
| 20. | Athens | 6.3% | 2.2%(+4.12)#20 | 2.6%(+3.78)#2,206 |
| 21. | Mount Pleasant | 6.3% | 2.2%(+4.08)#21 | 2.6%(+3.74)#2,239 |
| 22. | Bolivar | 6.1% | 2.2%(+3.87)#22 | 2.6%(+3.53)#2,399 |
| 23. | Counce | 6.0% | 2.2%(+3.73)#23 | 2.6%(+3.39)#2,501 |
| 24. | Apison | 5.9% | 2.2%(+3.67)#24 | 2.6%(+3.33)#2,542 |
| 25. | Sharon | 5.6% | 2.2%(+3.35)#25 | 2.6%(+3.02)#2,838 |
| 26. | South Pittsburg | 5.5% | 2.2%(+3.29)#26 | 2.6%(+2.96)#2,907 |
| 27. | Wartrace | 5.2% | 2.2%(+3.02)#27 | 2.6%(+2.68)#3,168 |
| 28. | Blountville | 5.2% | 2.2%(+2.98)#28 | 2.6%(+2.65)#3,207 |
| 29. | Ramer | 5.2% | 2.2%(+2.96)#29 | 2.6%(+2.62)#3,225 |
| 30. | Elizabethton | 5.2% | 2.2%(+2.95)#30 | 2.6%(+2.61)#3,234 |
| 31. | Rockvale | 5.1% | 2.2%(+2.91)#31 | 2.6%(+2.57)#3,274 |
| 32. | Watertown | 5.1% | 2.2%(+2.91)#32 | 2.6%(+2.57)#3,277 |
| 33. | Sneedville | 5.1% | 2.2%(+2.85)#33 | 2.6%(+2.52)#3,349 |
| 34. | South Cleveland | 5.1% | 2.2%(+2.84)#34 | 2.6%(+2.50)#3,366 |
| 35. | Halls | 5.0% | 2.2%(+2.79)#35 | 2.6%(+2.46)#3,429 |
| 36. | Norene | 4.9% | 2.2%(+2.71)#36 | 2.6%(+2.38)#3,544 |
| 37. | Fairfield Glade | 4.7% | 2.2%(+2.44)#37 | 2.6%(+2.10)#3,908 |
| 38. | Lake Tansi | 4.6% | 2.2%(+2.34)#38 | 2.6%(+2.00)#4,053 |
| 39. | Jefferson City | 4.6% | 2.2%(+2.34)#39 | 2.6%(+2.00)#4,057 |
| 40. | Seymour | 4.5% | 2.2%(+2.25)#40 | 2.6%(+1.92)#4,196 |
| 41. | Bluff City | 4.5% | 2.2%(+2.24)#41 | 2.6%(+1.90)#4,224 |
| 42. | Bell Buckle | 4.4% | 2.2%(+2.21)#42 | 2.6%(+1.88)#4,266 |
| 43. | St Joseph | 4.3% | 2.2%(+2.05)#43 | 2.6%(+1.71)#4,520 |
| 44. | Falling Water | 4.3% | 2.2%(+2.04)#44 | 2.6%(+1.70)#4,536 |
| 45. | Red Bank | 4.2% | 2.2%(+2.00)#45 | 2.6%(+1.66)#4,615 |
| 46. | Lewisburg | 4.2% | 2.2%(+1.99)#46 | 2.6%(+1.65)#4,634 |
| 47. | Vanleer | 4.2% | 2.2%(+1.94)#47 | 2.6%(+1.60)#4,733 |
| 48. | Cookeville | 4.1% | 2.2%(+1.89)#48 | 2.6%(+1.55)#4,828 |
| 49. | Collinwood | 4.1% | 2.2%(+1.87)#49 | 2.6%(+1.54)#4,858 |
| 50. | Erwin | 4.1% | 2.2%(+1.87)#50 | 2.6%(+1.53)#4,873 |
| 51. | Mascot | 4.0% | 2.2%(+1.77)#51 | 2.6%(+1.43)#5,067 |
| 52. | Tazewell | 3.9% | 2.2%(+1.68)#52 | 2.6%(+1.34)#5,253 |
| 53. | Cross Plains | 3.8% | 2.2%(+1.56)#53 | 2.6%(+1.22)#5,548 |
| 54. | Greenback | 3.8% | 2.2%(+1.55)#54 | 2.6%(+1.22)#5,561 |
| 55. | Maynardville | 3.8% | 2.2%(+1.53)#55 | 2.6%(+1.19)#5,628 |
| 56. | Centertown | 3.7% | 2.2%(+1.51)#56 | 2.6%(+1.17)#5,681 |
| 57. | Roan Mountain | 3.6% | 2.2%(+1.40)#57 | 2.6%(+1.06)#5,973 |
| 58. | Parsons | 3.6% | 2.2%(+1.38)#58 | 2.6%(+1.05)#6,026 |
| 59. | New Johnsonville | 3.6% | 2.2%(+1.37)#59 | 2.6%(+1.04)#6,053 |
| 60. | Cumberland Gap | 3.6% | 2.2%(+1.35)#60 | 2.6%(+1.01)#6,130 |
| 61. | East Ridge | 3.5% | 2.2%(+1.28)#61 | 2.6%(+0.946)#6,328 |
| 62. | Martin | 3.5% | 2.2%(+1.26)#62 | 2.6%(+0.926)#6,387 |
| 63. | Castalian Springs | 3.5% | 2.2%(+1.24)#63 | 2.6%(+0.906)#6,448 |
| 64. | Lawrenceburg | 3.4% | 2.2%(+1.17)#64 | 2.6%(+0.832)#6,673 |
| 65. | Camden | 3.4% | 2.2%(+1.16)#65 | 2.6%(+0.821)#6,712 |
| 66. | Morristown | 3.3% | 2.2%(+1.10)#66 | 2.6%(+0.766)#6,917 |
| 67. | Pigeon Forge | 3.3% | 2.2%(+1.10)#67 | 2.6%(+0.762)#6,923 |
| 68. | Finger | 3.3% | 2.2%(+1.09)#68 | 2.6%(+0.749)#6,975 |
| 69. | Goodlettsville | 3.3% | 2.2%(+1.05)#69 | 2.6%(+0.716)#7,057 |
| 70. | White Pine | 3.3% | 2.2%(+1.04)#70 | 2.6%(+0.707)#7,093 |
| 71. | Oak Hill | 3.2% | 2.2%(+1.01)#71 | 2.6%(+0.676)#7,196 |
| 72. | Knoxville | 3.2% | 2.2%(+0.989)#72 | 2.6%(+0.653)#7,275 |
| 73. | Clarksville | 3.2% | 2.2%(+0.987)#73 | 2.6%(+0.650)#7,285 |
| 74. | Blaine | 3.2% | 2.2%(+0.982)#74 | 2.6%(+0.646)#7,302 |
| 75. | Union City | 3.2% | 2.2%(+0.952)#75 | 2.6%(+0.616)#7,399 |
| 76. | Berry Hill | 3.2% | 2.2%(+0.946)#76 | 2.6%(+0.610)#7,426 |
| 77. | Ridgely | 3.2% | 2.2%(+0.942)#77 | 2.6%(+0.606)#7,443 |
| 78. | Brentwood | 3.1% | 2.2%(+0.900)#78 | 2.6%(+0.564)#7,579 |
| 79. | Signal Mountain | 3.1% | 2.2%(+0.848)#79 | 2.6%(+0.512)#7,800 |
| 80. | Atwood | 3.0% | 2.2%(+0.817)#80 | 2.6%(+0.481)#7,923 |
| 81. | Nolensville | 3.0% | 2.2%(+0.812)#81 | 2.6%(+0.476)#7,928 |
| 82. | Bon Aqua Junction | 3.0% | 2.2%(+0.799)#82 | 2.6%(+0.463)#7,996 |
| 83. | Wartburg | 3.0% | 2.2%(+0.796)#83 | 2.6%(+0.460)#8,006 |
| 84. | Westmoreland | 3.0% | 2.2%(+0.794)#84 | 2.6%(+0.458)#8,019 |
| 85. | Atoka | 3.0% | 2.2%(+0.761)#85 | 2.6%(+0.424)#8,142 |
| 86. | Fairmount | 3.0% | 2.2%(+0.740)#86 | 2.6%(+0.404)#8,225 |
| 87. | Collegedale | 3.0% | 2.2%(+0.739)#87 | 2.6%(+0.402)#8,230 |
| 88. | Franklin | 3.0% | 2.2%(+0.732)#88 | 2.6%(+0.396)#8,258 |
| 89. | Sewanee | 2.9% | 2.2%(+0.691)#89 | 2.6%(+0.354)#8,422 |
| 90. | Middle Valley | 2.8% | 2.2%(+0.621)#90 | 2.6%(+0.285)#8,717 |
| 91. | Maryville | 2.8% | 2.2%(+0.605)#91 | 2.6%(+0.269)#8,780 |
| 92. | Smithville | 2.8% | 2.2%(+0.594)#92 | 2.6%(+0.257)#8,834 |
| 93. | Hohenwald | 2.8% | 2.2%(+0.589)#93 | 2.6%(+0.252)#8,867 |
| 94. | Greenbrier | 2.8% | 2.2%(+0.564)#94 | 2.6%(+0.228)#8,974 |
| 95. | Mowbray Mountain | 2.8% | 2.2%(+0.561)#95 | 2.6%(+0.225)#8,983 |
| 96. | Enville | 2.8% | 2.2%(+0.552)#96 | 2.6%(+0.215)#9,040 |
| 97. | Green Hill | 2.8% | 2.2%(+0.543)#97 | 2.6%(+0.207)#9,069 |
| 98. | Cornersville | 2.8% | 2.2%(+0.533)#98 | 2.6%(+0.196)#9,120 |
| 99. | Fairview | 2.7% | 2.2%(+0.514)#99 | 2.6%(+0.178)#9,199 |
| 100. | Sevierville | 2.7% | 2.2%(+0.508)#100 | 2.6%(+0.172)#9,227 |
Common Questions
What are the Top 10 Cities with the Highest Percentage of Population Employed in Personal Care and Service in Tennessee?
Top 10 Cities with the Highest Percentage of Population Employed in Personal Care and Service in Tennessee are:
#1
14.8%
#2
10.2%
#3
9.0%
#4
8.6%
#5
8.5%
#6
8.0%
#7
7.0%
#8
7.0%
#9
6.8%
#10
6.7%
What city has the Highest Percentage of Population Employed in Personal Care and Service in Tennessee?
Ooltewah has the Highest Percentage of Population Employed in Personal Care and Service in Tennessee with 14.8%.
What is the Percentage of Population Employed in Personal Care and Service in the State of Tennessee?
Percentage of Population Employed in Personal Care and Service in Tennessee is 2.2%.
What is the Percentage of Population Employed in Personal Care and Service in the United States?
Percentage of Population Employed in Personal Care and Service in the United States is 2.6%.