Cities with the Highest Percentage of Population Employed in Management in North Carolina
RELATED REPORTS & OPTIONS
Management
North Carolina
Compare Cities
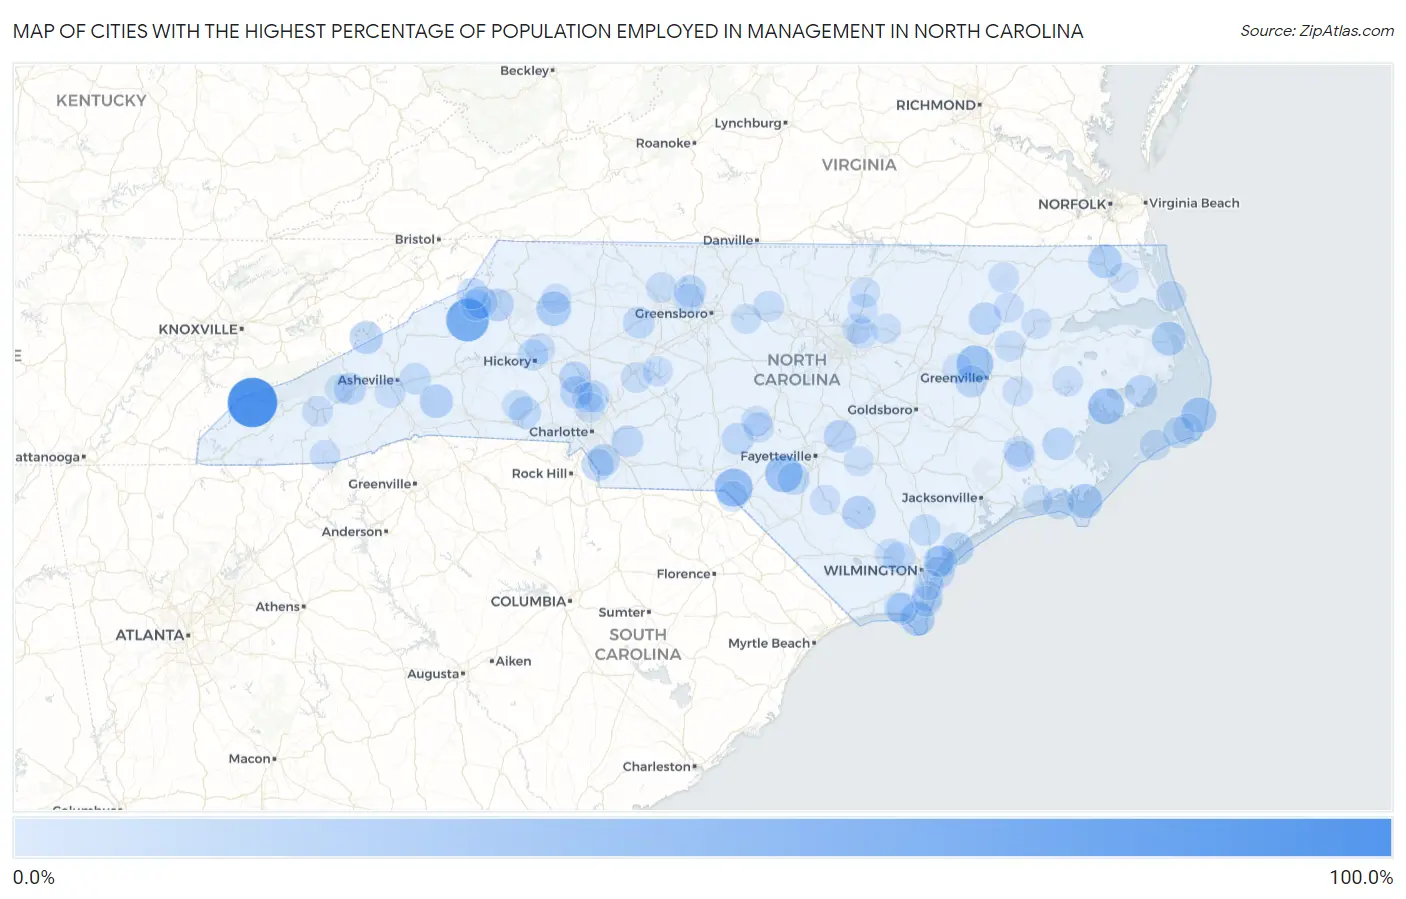
Map of Cities with the Highest Percentage of Population Employed in Management in North Carolina
0.0%
100.0%
Cities with the Highest Percentage of Population Employed in Management in North Carolina
| City | % Employed | vs State | vs National | |
| 1. | Fontana Dam | 100.0% | 11.3%(+88.7)#1 | 11.0%(+89.0)#62 |
| 2. | Crouse | 76.7% | 11.3%(+65.4)#2 | 11.0%(+65.6)#93 |
| 3. | Crossnore | 70.4% | 11.3%(+59.1)#3 | 11.0%(+59.4)#107 |
| 4. | Old Hundred | 50.0% | 11.3%(+38.7)#4 | 11.0%(+39.0)#233 |
| 5. | Dundarrach | 47.1% | 11.3%(+35.8)#5 | 11.0%(+36.0)#296 |
| 6. | Belvoir | 44.3% | 11.3%(+33.0)#6 | 11.0%(+33.3)#343 |
| 7. | Swan Quarter | 41.4% | 11.3%(+30.1)#7 | 11.0%(+30.4)#403 |
| 8. | Cape Colony | 39.9% | 11.3%(+28.6)#8 | 11.0%(+28.9)#443 |
| 9. | Avon | 36.9% | 11.3%(+25.6)#9 | 11.0%(+25.9)#526 |
| 10. | Marshallberg | 35.7% | 11.3%(+24.4)#10 | 11.0%(+24.7)#573 |
| 11. | Moravian Falls | 35.7% | 11.3%(+24.4)#11 | 11.0%(+24.7)#574 |
| 12. | Grandfather | 35.7% | 11.3%(+24.4)#12 | 11.0%(+24.7)#577 |
| 13. | Bald Head Island | 34.6% | 11.3%(+23.3)#13 | 11.0%(+23.6)#626 |
| 14. | South Mills | 32.7% | 11.3%(+21.4)#14 | 11.0%(+21.7)#733 |
| 15. | Manns Harbor | 32.0% | 11.3%(+20.7)#15 | 11.0%(+21.0)#769 |
| 16. | White Lake | 31.2% | 11.3%(+19.9)#16 | 11.0%(+20.2)#815 |
| 17. | Lake Lure | 30.8% | 11.3%(+19.5)#17 | 11.0%(+19.8)#842 |
| 18. | Hot Springs | 29.3% | 11.3%(+18.0)#18 | 11.0%(+18.3)#959 |
| 19. | Governors Club | 29.2% | 11.3%(+17.9)#19 | 11.0%(+18.1)#968 |
| 20. | Governors | 29.1% | 11.3%(+17.8)#20 | 11.0%(+18.1)#979 |
| 21. | Falcon | 28.6% | 11.3%(+17.3)#21 | 11.0%(+17.6)#1,014 |
| 22. | Bowdens | 28.2% | 11.3%(+16.9)#22 | 11.0%(+17.2)#1,062 |
| 23. | Blowing Rock | 28.1% | 11.3%(+16.8)#23 | 11.0%(+17.1)#1,079 |
| 24. | Stonewall | 27.4% | 11.3%(+16.1)#24 | 11.0%(+16.4)#1,148 |
| 25. | Hobgood | 27.3% | 11.3%(+16.0)#25 | 11.0%(+16.3)#1,151 |
| 26. | Seven Devils | 27.1% | 11.3%(+15.8)#26 | 11.0%(+16.1)#1,187 |
| 27. | Westport | 26.9% | 11.3%(+15.6)#27 | 11.0%(+15.9)#1,218 |
| 28. | Marvin | 26.7% | 11.3%(+15.4)#28 | 11.0%(+15.7)#1,242 |
| 29. | Topsail Beach | 26.6% | 11.3%(+15.3)#29 | 11.0%(+15.5)#1,262 |
| 30. | Engelhard | 26.4% | 11.3%(+15.1)#30 | 11.0%(+15.4)#1,290 |
| 31. | Stokesdale | 26.2% | 11.3%(+14.9)#31 | 11.0%(+15.2)#1,314 |
| 32. | Porters Neck | 26.1% | 11.3%(+14.8)#32 | 11.0%(+15.1)#1,324 |
| 33. | Lumber Bridge | 26.1% | 11.3%(+14.8)#33 | 11.0%(+15.1)#1,337 |
| 34. | St James | 25.9% | 11.3%(+14.6)#34 | 11.0%(+14.8)#1,371 |
| 35. | Weddington | 25.7% | 11.3%(+14.4)#35 | 11.0%(+14.7)#1,394 |
| 36. | Lake Norman Of Catawba | 25.7% | 11.3%(+14.3)#36 | 11.0%(+14.6)#1,397 |
| 37. | Bell Arthur | 25.1% | 11.3%(+13.8)#37 | 11.0%(+14.1)#1,479 |
| 38. | Lake Junaluska | 25.1% | 11.3%(+13.8)#38 | 11.0%(+14.1)#1,480 |
| 39. | Wrightsville Beach | 24.8% | 11.3%(+13.5)#39 | 11.0%(+13.8)#1,558 |
| 40. | Deep Run | 24.7% | 11.3%(+13.4)#40 | 11.0%(+13.7)#1,573 |
| 41. | Foxfire | 24.5% | 11.3%(+13.2)#41 | 11.0%(+13.5)#1,598 |
| 42. | Fairview | 24.5% | 11.3%(+13.2)#42 | 11.0%(+13.5)#1,601 |
| 43. | Waco | 24.5% | 11.3%(+13.2)#43 | 11.0%(+13.5)#1,602 |
| 44. | Cypress Landing | 24.3% | 11.3%(+13.0)#44 | 11.0%(+13.3)#1,640 |
| 45. | Linville | 24.2% | 11.3%(+12.9)#45 | 11.0%(+13.2)#1,664 |
| 46. | Bermuda Run | 24.0% | 11.3%(+12.7)#46 | 11.0%(+13.0)#1,701 |
| 47. | Davidson | 23.7% | 11.3%(+12.4)#47 | 11.0%(+12.7)#1,763 |
| 48. | Hatteras | 23.7% | 11.3%(+12.4)#48 | 11.0%(+12.6)#1,775 |
| 49. | St Helena | 23.6% | 11.3%(+12.3)#49 | 11.0%(+12.5)#1,797 |
| 50. | Sugar Mountain | 22.7% | 11.3%(+11.4)#50 | 11.0%(+11.7)#1,980 |
| 51. | Swannanoa | 22.7% | 11.3%(+11.4)#51 | 11.0%(+11.6)#1,987 |
| 52. | Atlantic Beach | 22.6% | 11.3%(+11.3)#52 | 11.0%(+11.5)#2,010 |
| 53. | Northlakes | 22.1% | 11.3%(+10.8)#53 | 11.0%(+11.1)#2,113 |
| 54. | Beech Mountain | 22.0% | 11.3%(+10.7)#54 | 11.0%(+11.0)#2,129 |
| 55. | Northwest | 21.0% | 11.3%(+9.70)#55 | 11.0%(+9.99)#2,423 |
| 56. | Everetts | 20.8% | 11.3%(+9.47)#56 | 11.0%(+9.75)#2,496 |
| 57. | Carolina Beach | 20.7% | 11.3%(+9.42)#57 | 11.0%(+9.70)#2,511 |
| 58. | Trent Woods | 20.7% | 11.3%(+9.38)#58 | 11.0%(+9.66)#2,525 |
| 59. | Woodlawn | 20.7% | 11.3%(+9.36)#59 | 11.0%(+9.64)#2,530 |
| 60. | Bayshore | 20.4% | 11.3%(+9.12)#60 | 11.0%(+9.41)#2,601 |
| 61. | Bent Creek | 20.3% | 11.3%(+9.01)#61 | 11.0%(+9.29)#2,632 |
| 62. | Kure Beach | 20.3% | 11.3%(+8.97)#62 | 11.0%(+9.25)#2,652 |
| 63. | Germanton | 20.1% | 11.3%(+8.75)#63 | 11.0%(+9.03)#2,719 |
| 64. | Dillsboro | 20.0% | 11.3%(+8.70)#64 | 11.0%(+8.98)#2,736 |
| 65. | Granite Quarry | 19.8% | 11.3%(+8.48)#65 | 11.0%(+8.77)#2,842 |
| 66. | Ocracoke | 19.7% | 11.3%(+8.42)#66 | 11.0%(+8.70)#2,861 |
| 67. | Whispering Pines | 19.4% | 11.3%(+8.07)#67 | 11.0%(+8.35)#2,996 |
| 68. | Fallston | 19.3% | 11.3%(+8.04)#68 | 11.0%(+8.32)#3,006 |
| 69. | Bethlehem | 19.3% | 11.3%(+7.96)#69 | 11.0%(+8.24)#3,038 |
| 70. | Woodland | 19.2% | 11.3%(+7.93)#70 | 11.0%(+8.21)#3,048 |
| 71. | Brices Creek | 19.2% | 11.3%(+7.90)#71 | 11.0%(+8.19)#3,064 |
| 72. | Carthage | 19.2% | 11.3%(+7.88)#72 | 11.0%(+8.17)#3,073 |
| 73. | Cornelius | 19.1% | 11.3%(+7.80)#73 | 11.0%(+8.08)#3,104 |
| 74. | Oak Ridge | 19.1% | 11.3%(+7.80)#74 | 11.0%(+8.08)#3,105 |
| 75. | Rolesville | 19.1% | 11.3%(+7.75)#75 | 11.0%(+8.03)#3,121 |
| 76. | Riegelwood | 18.9% | 11.3%(+7.64)#76 | 11.0%(+7.92)#3,162 |
| 77. | Gibson | 18.8% | 11.3%(+7.53)#77 | 11.0%(+7.81)#3,205 |
| 78. | Pantego | 18.8% | 11.3%(+7.51)#78 | 11.0%(+7.79)#3,213 |
| 79. | Broad Creek | 18.7% | 11.3%(+7.43)#79 | 11.0%(+7.72)#3,246 |
| 80. | Duck | 18.7% | 11.3%(+7.36)#80 | 11.0%(+7.64)#3,278 |
| 81. | Southmont | 18.6% | 11.3%(+7.34)#81 | 11.0%(+7.62)#3,289 |
| 82. | Tar Heel | 18.5% | 11.3%(+7.22)#82 | 11.0%(+7.50)#3,349 |
| 83. | Highlands | 18.4% | 11.3%(+7.12)#83 | 11.0%(+7.41)#3,389 |
| 84. | Windsor | 18.4% | 11.3%(+7.12)#84 | 11.0%(+7.40)#3,398 |
| 85. | Wake Forest | 18.4% | 11.3%(+7.10)#85 | 11.0%(+7.38)#3,408 |
| 86. | Frisco | 18.3% | 11.3%(+7.02)#86 | 11.0%(+7.30)#3,462 |
| 87. | Lewiston Woodville | 18.3% | 11.3%(+7.00)#87 | 11.0%(+7.28)#3,472 |
| 88. | Alamance | 18.3% | 11.3%(+6.98)#88 | 11.0%(+7.26)#3,486 |
| 89. | Franklinton | 18.2% | 11.3%(+6.91)#89 | 11.0%(+7.19)#3,511 |
| 90. | Chocowinity | 18.2% | 11.3%(+6.88)#90 | 11.0%(+7.16)#3,521 |
| 91. | Camden | 18.1% | 11.3%(+6.78)#91 | 11.0%(+7.06)#3,583 |
| 92. | Fountain | 17.9% | 11.3%(+6.65)#92 | 11.0%(+6.93)#3,644 |
| 93. | North Wilkesboro | 17.9% | 11.3%(+6.64)#93 | 11.0%(+6.92)#3,657 |
| 94. | Huntersville | 17.9% | 11.3%(+6.61)#94 | 11.0%(+6.89)#3,675 |
| 95. | Oak Island | 17.9% | 11.3%(+6.59)#95 | 11.0%(+6.87)#3,682 |
| 96. | Kittrell | 17.9% | 11.3%(+6.56)#96 | 11.0%(+6.84)#3,703 |
| 97. | Salemburg | 17.7% | 11.3%(+6.42)#97 | 11.0%(+6.70)#3,771 |
| 98. | Bunn | 17.7% | 11.3%(+6.39)#98 | 11.0%(+6.68)#3,781 |
| 99. | Myrtle Grove | 17.6% | 11.3%(+6.30)#99 | 11.0%(+6.58)#3,842 |
| 100. | Maggie Valley | 17.5% | 11.3%(+6.24)#100 | 11.0%(+6.52)#3,875 |
Common Questions
What are the Top 10 Cities with the Highest Percentage of Population Employed in Management in North Carolina?
Top 10 Cities with the Highest Percentage of Population Employed in Management in North Carolina are:
#1
100.0%
#2
70.4%
#3
50.0%
#4
47.1%
#5
44.3%
#6
41.4%
#7
36.9%
#8
35.7%
#9
35.7%
#10
34.6%
What city has the Highest Percentage of Population Employed in Management in North Carolina?
Fontana Dam has the Highest Percentage of Population Employed in Management in North Carolina with 100.0%.
What is the Percentage of Population Employed in Management in the State of North Carolina?
Percentage of Population Employed in Management in North Carolina is 11.3%.
What is the Percentage of Population Employed in Management in the United States?
Percentage of Population Employed in Management in the United States is 11.0%.