Cities with the Highest Percentage of Population Employed in Management in Oklahoma
RELATED REPORTS & OPTIONS
Management
Oklahoma
Compare Cities
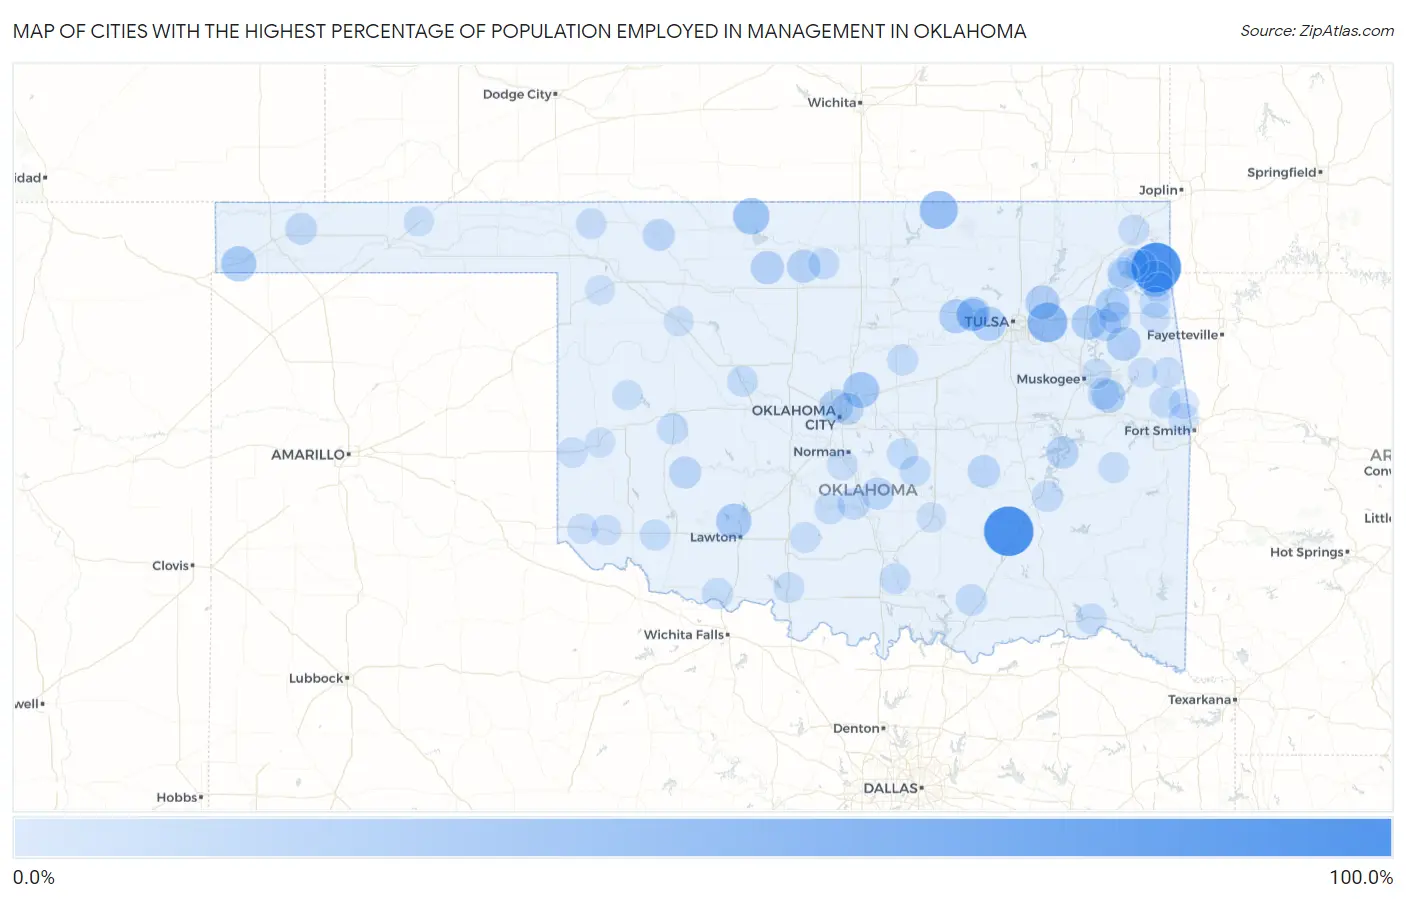
Map of Cities with the Highest Percentage of Population Employed in Management in Oklahoma
0.0%
100.0%
Cities with the Highest Percentage of Population Employed in Management in Oklahoma
| City | % Employed | vs State | vs National | |
| 1. | Butler | 100.0% | 10.1%(+89.9)#1 | 11.0%(+89.0)#9 |
| 2. | Pontotoc | 100.0% | 10.1%(+89.9)#2 | 11.0%(+89.0)#18 |
| 3. | Wardville | 100.0% | 10.1%(+89.9)#3 | 11.0%(+89.0)#35 |
| 4. | Fair Oaks | 56.8% | 10.1%(+46.7)#4 | 11.0%(+45.8)#174 |
| 5. | Adams | 55.3% | 10.1%(+45.2)#5 | 11.0%(+44.3)#188 |
| 6. | Grainola | 50.0% | 10.1%(+39.9)#6 | 11.0%(+39.0)#244 |
| 7. | Eagle | 50.0% | 10.1%(+39.9)#7 | 11.0%(+39.0)#250 |
| 8. | Bache | 48.1% | 10.1%(+38.0)#8 | 11.0%(+37.1)#278 |
| 9. | Byron | 42.9% | 10.1%(+32.7)#9 | 11.0%(+31.8)#374 |
| 10. | Deer Lick | 42.5% | 10.1%(+32.4)#10 | 11.0%(+31.5)#378 |
| 11. | Hochatown | 42.2% | 10.1%(+32.0)#11 | 11.0%(+31.1)#382 |
| 12. | Moodys | 40.6% | 10.1%(+30.5)#12 | 11.0%(+29.6)#422 |
| 13. | Arcadia | 40.5% | 10.1%(+30.3)#13 | 11.0%(+29.5)#424 |
| 14. | Medicine Park | 38.6% | 10.1%(+28.4)#14 | 11.0%(+27.5)#474 |
| 15. | Felt | 37.9% | 10.1%(+27.8)#15 | 11.0%(+26.9)#491 |
| 16. | Edgewater Park | 35.9% | 10.1%(+25.8)#16 | 11.0%(+24.9)#568 |
| 17. | Sand Point | 34.5% | 10.1%(+24.4)#17 | 11.0%(+23.5)#634 |
| 18. | Mazie | 34.1% | 10.1%(+24.0)#18 | 11.0%(+23.1)#646 |
| 19. | Pump Back | 33.7% | 10.1%(+23.6)#19 | 11.0%(+22.7)#660 |
| 20. | Terlton | 33.3% | 10.1%(+23.2)#20 | 11.0%(+22.3)#683 |
| 21. | Valley Park | 33.3% | 10.1%(+23.2)#21 | 11.0%(+22.3)#697 |
| 22. | Lotsee | 33.3% | 10.1%(+23.2)#22 | 11.0%(+22.3)#703 |
| 23. | Gideon | 33.0% | 10.1%(+22.9)#23 | 11.0%(+22.0)#712 |
| 24. | Oak Grove | 32.4% | 10.1%(+22.3)#24 | 11.0%(+21.4)#747 |
| 25. | Leonard | 31.7% | 10.1%(+21.6)#25 | 11.0%(+20.7)#785 |
| 26. | Little Rock | 31.7% | 10.1%(+21.6)#26 | 11.0%(+20.7)#786 |
| 27. | Nichols Hills | 31.2% | 10.1%(+21.0)#27 | 11.0%(+20.2)#818 |
| 28. | Goltry | 30.3% | 10.1%(+20.1)#28 | 11.0%(+19.2)#885 |
| 29. | Kremlin | 30.3% | 10.1%(+20.1)#29 | 11.0%(+19.2)#886 |
| 30. | Sour John | 30.0% | 10.1%(+19.9)#30 | 11.0%(+19.0)#904 |
| 31. | Mehan | 30.0% | 10.1%(+19.9)#31 | 11.0%(+19.0)#905 |
| 32. | Hodgen | 29.2% | 10.1%(+19.0)#32 | 11.0%(+18.1)#974 |
| 33. | Lone Chimney | 28.2% | 10.1%(+18.1)#33 | 11.0%(+17.2)#1,068 |
| 34. | Baron | 27.9% | 10.1%(+17.7)#34 | 11.0%(+16.9)#1,103 |
| 35. | Westport | 27.5% | 10.1%(+17.4)#35 | 11.0%(+16.5)#1,137 |
| 36. | Hough | 26.9% | 10.1%(+16.8)#36 | 11.0%(+15.9)#1,210 |
| 37. | Horntown | 26.7% | 10.1%(+16.5)#37 | 11.0%(+15.6)#1,249 |
| 38. | Dennis | 26.6% | 10.1%(+16.4)#38 | 11.0%(+15.6)#1,259 |
| 39. | Carlton Landing | 26.3% | 10.1%(+16.2)#39 | 11.0%(+15.3)#1,305 |
| 40. | Cedar Crest | 26.0% | 10.1%(+15.8)#40 | 11.0%(+14.9)#1,351 |
| 41. | Lake Aluma | 25.9% | 10.1%(+15.8)#41 | 11.0%(+14.9)#1,360 |
| 42. | Peckham | 25.9% | 10.1%(+15.8)#42 | 11.0%(+14.9)#1,361 |
| 43. | Ingalls | 25.6% | 10.1%(+15.5)#43 | 11.0%(+14.6)#1,410 |
| 44. | Gotebo | 25.3% | 10.1%(+15.2)#44 | 11.0%(+14.3)#1,451 |
| 45. | Elohim | 25.0% | 10.1%(+14.9)#45 | 11.0%(+14.0)#1,524 |
| 46. | Rosedale | 25.0% | 10.1%(+14.9)#46 | 11.0%(+14.0)#1,525 |
| 47. | Snake Creek | 24.5% | 10.1%(+14.3)#47 | 11.0%(+13.5)#1,605 |
| 48. | Freedom | 24.5% | 10.1%(+14.3)#48 | 11.0%(+13.4)#1,611 |
| 49. | Sand Hill | 24.4% | 10.1%(+14.2)#49 | 11.0%(+13.3)#1,629 |
| 50. | Keyes | 24.3% | 10.1%(+14.1)#50 | 11.0%(+13.3)#1,647 |
| 51. | Maysville | 23.7% | 10.1%(+13.6)#51 | 11.0%(+12.7)#1,761 |
| 52. | Fittstown | 23.3% | 10.1%(+13.2)#52 | 11.0%(+12.3)#1,848 |
| 53. | Kenefic | 22.6% | 10.1%(+12.4)#53 | 11.0%(+11.6)#2,004 |
| 54. | Cloud Creek | 22.2% | 10.1%(+12.1)#54 | 11.0%(+11.2)#2,075 |
| 55. | Bessie | 22.1% | 10.1%(+12.0)#55 | 11.0%(+11.1)#2,106 |
| 56. | Stoney Point | 21.7% | 10.1%(+11.6)#56 | 11.0%(+10.7)#2,204 |
| 57. | Cleora | 21.6% | 10.1%(+11.5)#57 | 11.0%(+10.6)#2,232 |
| 58. | Alderson | 21.6% | 10.1%(+11.4)#58 | 11.0%(+10.5)#2,255 |
| 59. | Tryon | 21.4% | 10.1%(+11.3)#59 | 11.0%(+10.4)#2,273 |
| 60. | Taylor Ferry | 21.2% | 10.1%(+11.1)#60 | 11.0%(+10.2)#2,353 |
| 61. | Hunter | 21.2% | 10.1%(+11.0)#61 | 11.0%(+10.1)#2,379 |
| 62. | Greenville | 21.2% | 10.1%(+11.0)#62 | 11.0%(+10.1)#2,381 |
| 63. | Erin Springs | 21.2% | 10.1%(+11.0)#63 | 11.0%(+10.1)#2,382 |
| 64. | Devol | 21.1% | 10.1%(+11.0)#64 | 11.0%(+10.1)#2,385 |
| 65. | Brooksville | 21.1% | 10.1%(+10.9)#65 | 11.0%(+10.0)#2,408 |
| 66. | Headrick | 20.6% | 10.1%(+10.4)#66 | 11.0%(+9.57)#2,554 |
| 67. | Disney | 20.5% | 10.1%(+10.4)#67 | 11.0%(+9.49)#2,573 |
| 68. | St Louis | 20.5% | 10.1%(+10.4)#68 | 11.0%(+9.49)#2,576 |
| 69. | Greenfield | 20.5% | 10.1%(+10.3)#69 | 11.0%(+9.43)#2,592 |
| 70. | Gene Autry | 20.4% | 10.1%(+10.3)#70 | 11.0%(+9.41)#2,600 |
| 71. | Bray | 20.2% | 10.1%(+10.1)#71 | 11.0%(+9.18)#2,673 |
| 72. | Fort Towson | 20.1% | 10.1%(+9.96)#72 | 11.0%(+9.08)#2,701 |
| 73. | Lequire | 20.0% | 10.1%(+9.86)#73 | 11.0%(+8.98)#2,751 |
| 74. | Narcissa | 20.0% | 10.1%(+9.86)#74 | 11.0%(+8.98)#2,755 |
| 75. | Zion | 20.0% | 10.1%(+9.86)#75 | 11.0%(+8.98)#2,772 |
| 76. | Buffalo | 19.6% | 10.1%(+9.44)#76 | 11.0%(+8.56)#2,903 |
| 77. | Goldsby | 19.3% | 10.1%(+9.14)#77 | 11.0%(+8.27)#3,029 |
| 78. | Grand Lake Towne | 19.2% | 10.1%(+9.09)#78 | 11.0%(+8.21)#3,050 |
| 79. | Pumpkin Hollow | 19.2% | 10.1%(+9.09)#79 | 11.0%(+8.21)#3,054 |
| 80. | Tonkawa Tribal Housing | 19.1% | 10.1%(+9.01)#80 | 11.0%(+8.13)#3,080 |
| 81. | Addington | 19.0% | 10.1%(+8.91)#81 | 11.0%(+8.03)#3,125 |
| 82. | Remy | 18.9% | 10.1%(+8.80)#82 | 11.0%(+7.92)#3,160 |
| 83. | Erick | 18.8% | 10.1%(+8.65)#83 | 11.0%(+7.77)#3,221 |
| 84. | Short | 18.4% | 10.1%(+8.28)#84 | 11.0%(+7.40)#3,394 |
| 85. | Gould | 18.4% | 10.1%(+8.28)#85 | 11.0%(+7.40)#3,396 |
| 86. | East Duke | 18.2% | 10.1%(+8.04)#86 | 11.0%(+7.16)#3,529 |
| 87. | Middleberg | 18.2% | 10.1%(+8.04)#87 | 11.0%(+7.16)#3,539 |
| 88. | Olive | 18.2% | 10.1%(+8.04)#88 | 11.0%(+7.16)#3,544 |
| 89. | Reagan | 18.2% | 10.1%(+8.04)#89 | 11.0%(+7.16)#3,550 |
| 90. | Sycamore | 17.9% | 10.1%(+7.81)#90 | 11.0%(+6.93)#3,649 |
| 91. | Flint Creek | 17.9% | 10.1%(+7.80)#91 | 11.0%(+6.92)#3,655 |
| 92. | Hammon | 17.8% | 10.1%(+7.69)#92 | 11.0%(+6.81)#3,717 |
| 93. | Hooker | 17.8% | 10.1%(+7.65)#93 | 11.0%(+6.77)#3,733 |
| 94. | Fort Gibson | 17.6% | 10.1%(+7.48)#94 | 11.0%(+6.60)#3,833 |
| 95. | Sayre | 17.3% | 10.1%(+7.19)#95 | 11.0%(+6.31)#3,993 |
| 96. | Seiling | 17.3% | 10.1%(+7.15)#96 | 11.0%(+6.27)#4,016 |
| 97. | Latta | 16.8% | 10.1%(+6.69)#97 | 11.0%(+5.81)#4,283 |
| 98. | Tenkiller | 16.8% | 10.1%(+6.68)#98 | 11.0%(+5.80)#4,289 |
| 99. | Fargo | 16.8% | 10.1%(+6.63)#99 | 11.0%(+5.75)#4,314 |
| 100. | Little Ponderosa | 16.8% | 10.1%(+6.62)#100 | 11.0%(+5.74)#4,330 |
Common Questions
What are the Top 10 Cities with the Highest Percentage of Population Employed in Management in Oklahoma?
Top 10 Cities with the Highest Percentage of Population Employed in Management in Oklahoma are:
What city has the Highest Percentage of Population Employed in Management in Oklahoma?
Butler has the Highest Percentage of Population Employed in Management in Oklahoma with 100.0%.
What is the Percentage of Population Employed in Management in the State of Oklahoma?
Percentage of Population Employed in Management in Oklahoma is 10.1%.
What is the Percentage of Population Employed in Management in the United States?
Percentage of Population Employed in Management in the United States is 11.0%.