Cities with the Highest Percentage of Population Employed in Management in Mississippi
RELATED REPORTS & OPTIONS
Management
Mississippi
Compare Cities
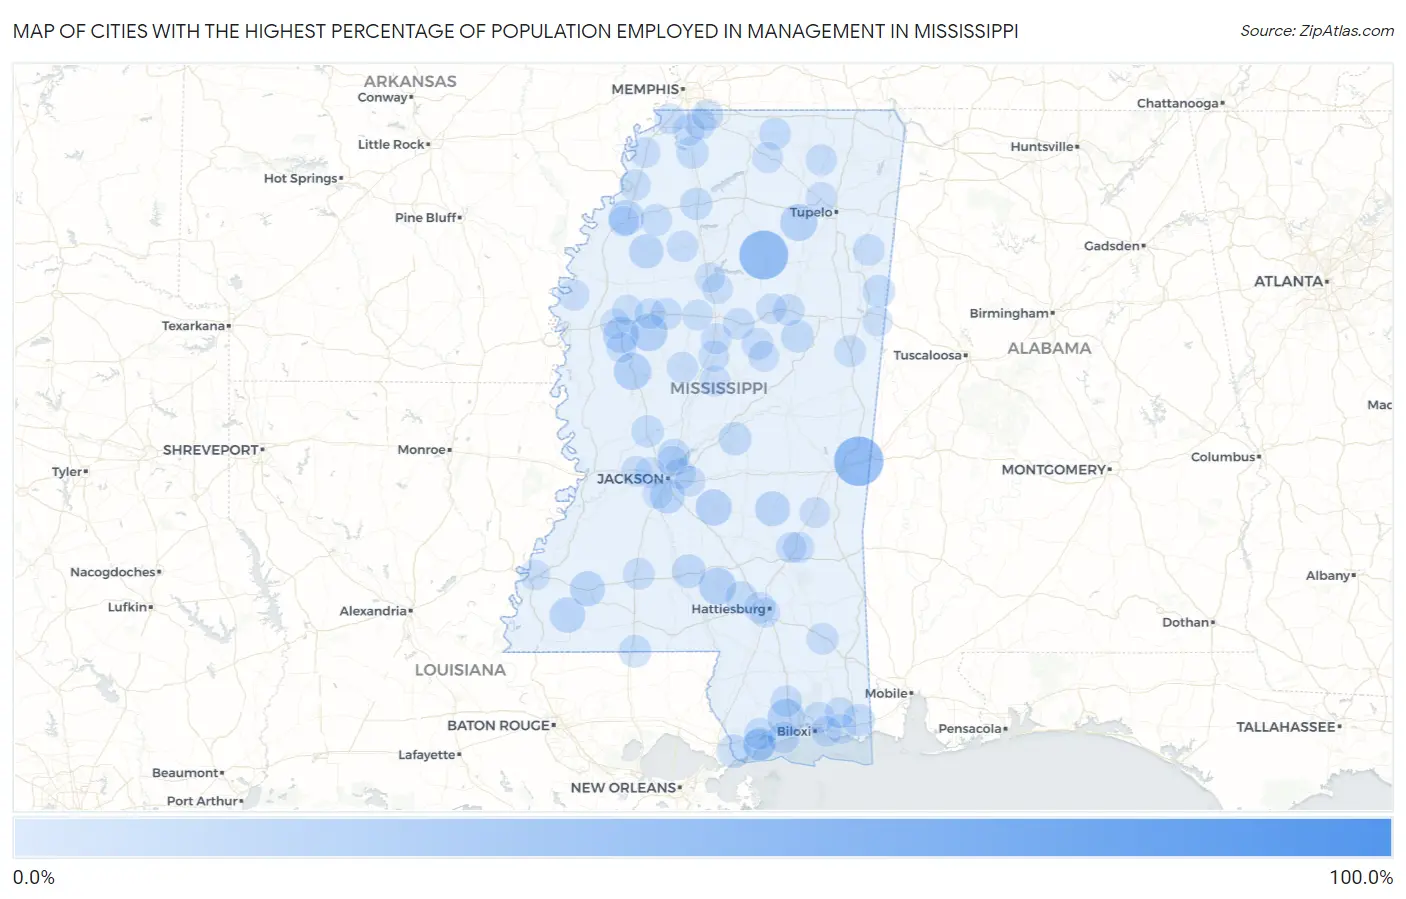
Map of Cities with the Highest Percentage of Population Employed in Management in Mississippi
0.0%
100.0%
Cities with the Highest Percentage of Population Employed in Management in Mississippi
| City | % Employed | vs State | vs National | |
| 1. | Panther Burn | 100.0% | 8.6%(+91.4)#1 | 11.0%(+89.0)#21 |
| 2. | Dundee | 100.0% | 8.6%(+91.4)#2 | 11.0%(+89.0)#38 |
| 3. | Paris | 54.3% | 8.6%(+45.8)#3 | 11.0%(+43.3)#196 |
| 4. | Elizabeth | 54.3% | 8.6%(+45.7)#4 | 11.0%(+43.2)#197 |
| 5. | Toomsuba | 49.1% | 8.6%(+40.6)#5 | 11.0%(+38.1)#268 |
| 6. | Pittsboro | 47.9% | 8.6%(+39.4)#6 | 11.0%(+36.9)#280 |
| 7. | Victoria | 36.2% | 8.6%(+27.7)#7 | 11.0%(+25.2)#555 |
| 8. | Eudora | 31.1% | 8.6%(+22.5)#8 | 11.0%(+20.0)#825 |
| 9. | Independence | 27.7% | 8.6%(+19.1)#9 | 11.0%(+16.6)#1,121 |
| 10. | Kokomo | 27.0% | 8.6%(+18.5)#10 | 11.0%(+16.0)#1,191 |
| 11. | Morgan City | 24.6% | 8.6%(+16.1)#11 | 11.0%(+13.6)#1,585 |
| 12. | Lyman | 24.1% | 8.6%(+15.5)#12 | 11.0%(+13.0)#1,694 |
| 13. | Silver City | 24.1% | 8.6%(+15.5)#13 | 11.0%(+13.0)#1,697 |
| 14. | Bassfield | 23.9% | 8.6%(+15.4)#14 | 11.0%(+12.9)#1,728 |
| 15. | Runnelstown | 23.8% | 8.6%(+15.2)#15 | 11.0%(+12.8)#1,754 |
| 16. | Algoma | 23.7% | 8.6%(+15.2)#16 | 11.0%(+12.7)#1,762 |
| 17. | Puckett | 22.2% | 8.6%(+13.6)#17 | 11.0%(+11.1)#2,097 |
| 18. | Inverness | 21.9% | 8.6%(+13.3)#18 | 11.0%(+10.9)#2,164 |
| 19. | Bovina | 20.6% | 8.6%(+12.0)#19 | 11.0%(+9.54)#2,560 |
| 20. | Mount Pleasant | 20.4% | 8.6%(+11.9)#20 | 11.0%(+9.39)#2,609 |
| 21. | Crosby | 20.3% | 8.6%(+11.8)#21 | 11.0%(+9.32)#2,625 |
| 22. | Lyon | 20.1% | 8.6%(+11.6)#22 | 11.0%(+9.08)#2,702 |
| 23. | Meadville | 19.6% | 8.6%(+11.0)#23 | 11.0%(+8.55)#2,911 |
| 24. | Louin | 19.6% | 8.6%(+11.0)#24 | 11.0%(+8.54)#2,916 |
| 25. | Cleary | 18.9% | 8.6%(+10.4)#25 | 11.0%(+7.89)#3,173 |
| 26. | Sumner | 18.4% | 8.6%(+9.85)#26 | 11.0%(+7.38)#3,406 |
| 27. | Silver Creek | 17.4% | 8.6%(+8.84)#27 | 11.0%(+6.37)#3,955 |
| 28. | Pearlington | 17.2% | 8.6%(+8.69)#28 | 11.0%(+6.22)#4,049 |
| 29. | Wheeler | 17.0% | 8.6%(+8.44)#29 | 11.0%(+5.97)#4,192 |
| 30. | Lakeview | 16.9% | 8.6%(+8.38)#30 | 11.0%(+5.92)#4,212 |
| 31. | Lena | 15.8% | 8.6%(+7.24)#31 | 11.0%(+4.77)#4,971 |
| 32. | Sturgis | 15.1% | 8.6%(+6.52)#32 | 11.0%(+4.05)#5,587 |
| 33. | Madison | 14.9% | 8.6%(+6.34)#33 | 11.0%(+3.87)#5,721 |
| 34. | Bay St Louis | 14.9% | 8.6%(+6.31)#34 | 11.0%(+3.84)#5,740 |
| 35. | Osyka | 14.4% | 8.6%(+5.85)#35 | 11.0%(+3.38)#6,137 |
| 36. | Caledonia | 14.4% | 8.6%(+5.84)#36 | 11.0%(+3.37)#6,145 |
| 37. | Coldwater | 14.3% | 8.6%(+5.78)#37 | 11.0%(+3.32)#6,199 |
| 38. | Batesville | 14.2% | 8.6%(+5.65)#38 | 11.0%(+3.18)#6,350 |
| 39. | Sumrall | 14.2% | 8.6%(+5.63)#39 | 11.0%(+3.16)#6,376 |
| 40. | Bentonia | 14.2% | 8.6%(+5.61)#40 | 11.0%(+3.14)#6,390 |
| 41. | Helena | 13.7% | 8.6%(+5.13)#41 | 11.0%(+2.66)#6,836 |
| 42. | Snow Lake Shores | 13.6% | 8.6%(+5.02)#42 | 11.0%(+2.55)#6,942 |
| 43. | Waveland | 13.5% | 8.6%(+4.98)#43 | 11.0%(+2.52)#6,987 |
| 44. | Mclain | 13.4% | 8.6%(+4.86)#44 | 11.0%(+2.39)#7,129 |
| 45. | Greenwood | 13.4% | 8.6%(+4.80)#45 | 11.0%(+2.33)#7,196 |
| 46. | French Camp | 13.3% | 8.6%(+4.78)#46 | 11.0%(+2.31)#7,217 |
| 47. | Diamondhead | 13.3% | 8.6%(+4.77)#47 | 11.0%(+2.30)#7,245 |
| 48. | Lambert | 13.3% | 8.6%(+4.75)#48 | 11.0%(+2.28)#7,264 |
| 49. | Bogue Chitto | 13.2% | 8.6%(+4.62)#49 | 11.0%(+2.15)#7,387 |
| 50. | Brookhaven | 13.0% | 8.6%(+4.44)#50 | 11.0%(+1.97)#7,582 |
| 51. | Long Beach | 12.8% | 8.6%(+4.24)#51 | 11.0%(+1.77)#7,813 |
| 52. | Kilmichael | 12.7% | 8.6%(+4.19)#52 | 11.0%(+1.72)#7,858 |
| 53. | Mathiston | 12.7% | 8.6%(+4.16)#53 | 11.0%(+1.70)#7,887 |
| 54. | Gluckstadt | 12.6% | 8.6%(+4.06)#54 | 11.0%(+1.59)#8,018 |
| 55. | Hatley | 12.6% | 8.6%(+4.05)#55 | 11.0%(+1.58)#8,028 |
| 56. | Brooksville | 12.6% | 8.6%(+4.02)#56 | 11.0%(+1.55)#8,057 |
| 57. | Hernando | 12.5% | 8.6%(+3.98)#57 | 11.0%(+1.51)#8,099 |
| 58. | Bridgetown | 12.5% | 8.6%(+3.95)#58 | 11.0%(+1.48)#8,132 |
| 59. | Charleston | 12.4% | 8.6%(+3.88)#59 | 11.0%(+1.41)#8,258 |
| 60. | Saucier | 12.4% | 8.6%(+3.87)#60 | 11.0%(+1.40)#8,267 |
| 61. | Arnold Line | 12.3% | 8.6%(+3.79)#61 | 11.0%(+1.32)#8,369 |
| 62. | Dumas | 12.3% | 8.6%(+3.79)#62 | 11.0%(+1.32)#8,378 |
| 63. | Latimer | 12.3% | 8.6%(+3.76)#63 | 11.0%(+1.29)#8,404 |
| 64. | Flowood | 12.3% | 8.6%(+3.74)#64 | 11.0%(+1.27)#8,427 |
| 65. | Lexington | 12.2% | 8.6%(+3.70)#65 | 11.0%(+1.23)#8,492 |
| 66. | Lula | 12.2% | 8.6%(+3.69)#66 | 11.0%(+1.23)#8,502 |
| 67. | Sandersville | 12.1% | 8.6%(+3.58)#67 | 11.0%(+1.11)#8,644 |
| 68. | Olive Branch | 12.0% | 8.6%(+3.47)#68 | 11.0%(+0.999)#8,799 |
| 69. | Benoit | 11.9% | 8.6%(+3.35)#69 | 11.0%(+0.885)#8,961 |
| 70. | Sherman | 11.8% | 8.6%(+3.29)#70 | 11.0%(+0.822)#9,045 |
| 71. | Potts Camp | 11.7% | 8.6%(+3.16)#71 | 11.0%(+0.692)#9,255 |
| 72. | Sallis | 11.6% | 8.6%(+3.03)#72 | 11.0%(+0.559)#9,442 |
| 73. | West | 11.5% | 8.6%(+2.99)#73 | 11.0%(+0.519)#9,507 |
| 74. | Pachuta | 11.5% | 8.6%(+2.92)#74 | 11.0%(+0.456)#9,607 |
| 75. | Tunica | 11.5% | 8.6%(+2.91)#75 | 11.0%(+0.445)#9,622 |
| 76. | Sharon | 11.4% | 8.6%(+2.89)#76 | 11.0%(+0.426)#9,642 |
| 77. | Vaiden | 11.3% | 8.6%(+2.72)#77 | 11.0%(+0.248)#9,913 |
| 78. | Carrollton | 11.3% | 8.6%(+2.70)#78 | 11.0%(+0.230)#9,945 |
| 79. | Morgantown | 11.1% | 8.6%(+2.59)#79 | 11.0%(+0.120)#10,099 |
| 80. | Mccool | 11.1% | 8.6%(+2.56)#80 | 11.0%(+0.091)#10,178 |
| 81. | Walls | 11.1% | 8.6%(+2.54)#81 | 11.0%(+0.075)#10,199 |
| 82. | Ridgeland | 11.0% | 8.6%(+2.41)#82 | 11.0%(-0.054)#10,376 |
| 83. | Clinton | 10.9% | 8.6%(+2.34)#83 | 11.0%(-0.129)#10,486 |
| 84. | Bolton | 10.8% | 8.6%(+2.27)#84 | 11.0%(-0.194)#10,581 |
| 85. | Elliott | 10.8% | 8.6%(+2.24)#85 | 11.0%(-0.228)#10,631 |
| 86. | Brandon | 10.7% | 8.6%(+2.19)#86 | 11.0%(-0.276)#10,705 |
| 87. | Sunflower | 10.7% | 8.6%(+2.15)#87 | 11.0%(-0.314)#10,769 |
| 88. | Vancleave | 10.7% | 8.6%(+2.10)#88 | 11.0%(-0.369)#10,850 |
| 89. | Mississippi Valley State University | 10.6% | 8.6%(+2.08)#89 | 11.0%(-0.389)#10,887 |
| 90. | Hermanville | 10.6% | 8.6%(+2.02)#90 | 11.0%(-0.443)#10,975 |
| 91. | Ocean Springs | 10.6% | 8.6%(+2.02)#91 | 11.0%(-0.446)#10,982 |
| 92. | Clarksdale | 10.5% | 8.6%(+1.98)#92 | 11.0%(-0.483)#11,016 |
| 93. | Eupora | 10.5% | 8.6%(+1.96)#93 | 11.0%(-0.503)#11,077 |
| 94. | Indianola | 10.2% | 8.6%(+1.70)#94 | 11.0%(-0.773)#11,537 |
| 95. | Gautier | 10.2% | 8.6%(+1.69)#95 | 11.0%(-0.775)#11,542 |
| 96. | Byram | 10.2% | 8.6%(+1.67)#96 | 11.0%(-0.794)#11,569 |
| 97. | Isola | 10.0% | 8.6%(+1.45)#97 | 11.0%(-1.02)#11,943 |
| 98. | Grenada | 10.0% | 8.6%(+1.41)#98 | 11.0%(-1.06)#12,039 |
| 99. | New Hope | 9.9% | 8.6%(+1.34)#99 | 11.0%(-1.13)#12,147 |
| 100. | Hattiesburg | 9.7% | 8.6%(+1.19)#100 | 11.0%(-1.28)#12,413 |
Common Questions
What are the Top 10 Cities with the Highest Percentage of Population Employed in Management in Mississippi?
Top 10 Cities with the Highest Percentage of Population Employed in Management in Mississippi are:
#1
49.1%
#2
47.9%
#3
24.6%
#4
24.1%
#5
24.1%
#6
23.9%
#7
23.7%
#8
22.2%
#9
21.9%
#10
20.3%
What city has the Highest Percentage of Population Employed in Management in Mississippi?
Toomsuba has the Highest Percentage of Population Employed in Management in Mississippi with 49.1%.
What is the Percentage of Population Employed in Management in the State of Mississippi?
Percentage of Population Employed in Management in Mississippi is 8.6%.
What is the Percentage of Population Employed in Management in the United States?
Percentage of Population Employed in Management in the United States is 11.0%.