Cities with the Highest Percentage of Population Employed in Management in New York
RELATED REPORTS & OPTIONS
Management
New York
Compare Cities
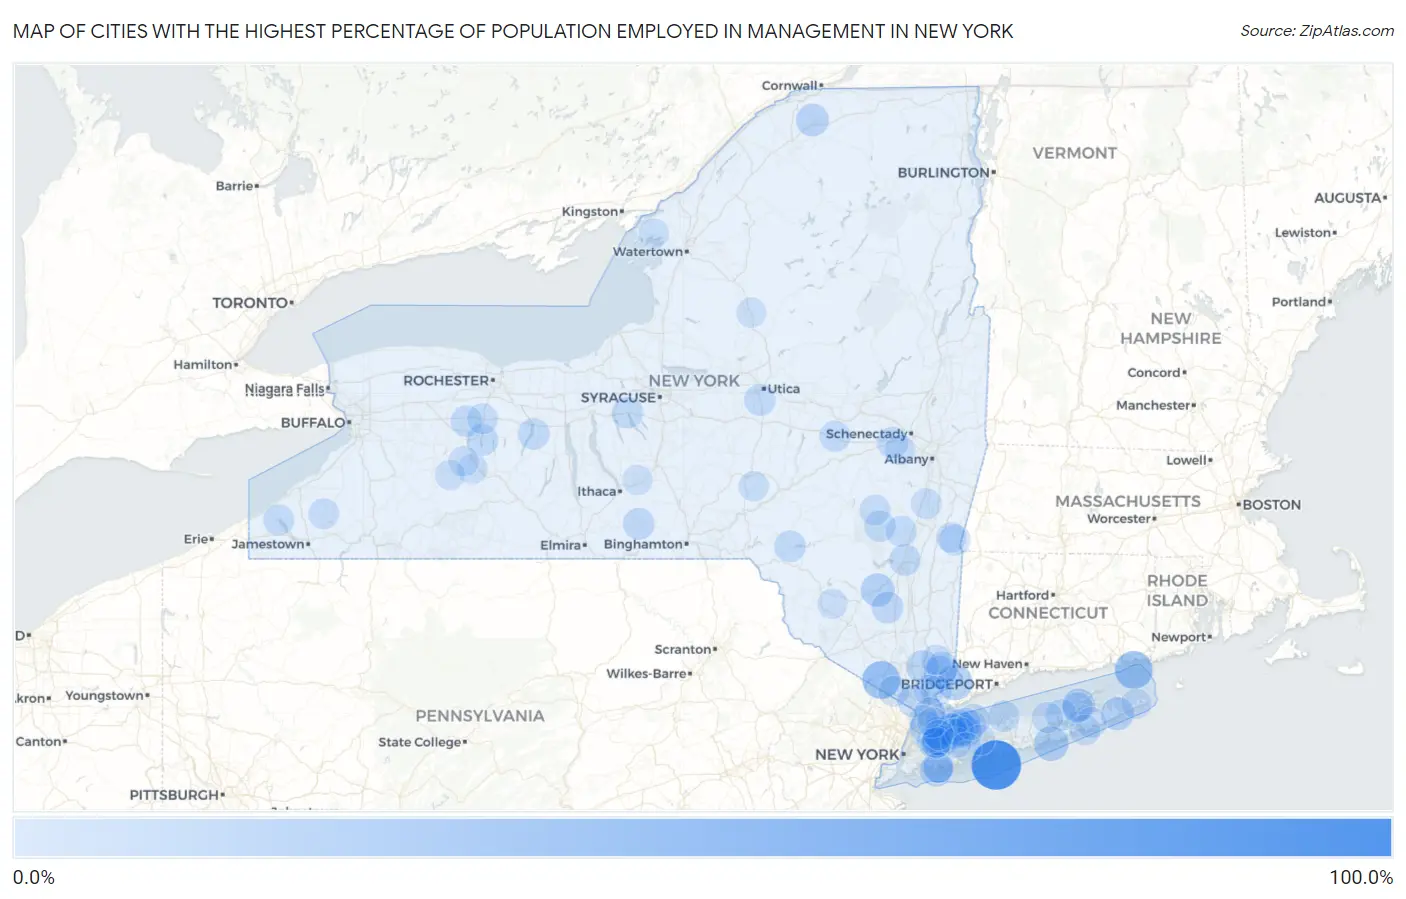
Map of Cities with the Highest Percentage of Population Employed in Management in New York
0.0%
100.0%
Cities with the Highest Percentage of Population Employed in Management in New York
| City | % Employed | vs State | vs National | |
| 1. | Captree | 100.0% | 10.9%(+89.1)#1 | 11.0%(+89.0)#2 |
| 2. | Saltaire | 100.0% | 10.9%(+89.1)#2 | 11.0%(+89.0)#75 |
| 3. | Upper Red Hook | 55.6% | 10.9%(+44.7)#3 | 11.0%(+44.5)#182 |
| 4. | Fishers Island | 51.3% | 10.9%(+40.4)#4 | 11.0%(+40.3)#221 |
| 5. | Tuxedo Park | 50.9% | 10.9%(+40.0)#5 | 11.0%(+39.9)#225 |
| 6. | Scotts Corners | 40.4% | 10.9%(+29.5)#6 | 11.0%(+29.4)#427 |
| 7. | West Hampton Dunes | 37.5% | 10.9%(+26.6)#7 | 11.0%(+26.5)#502 |
| 8. | Accord | 32.9% | 10.9%(+22.0)#8 | 11.0%(+21.9)#719 |
| 9. | Matinecock | 32.3% | 10.9%(+21.5)#9 | 11.0%(+21.3)#756 |
| 10. | Peconic | 31.8% | 10.9%(+21.0)#10 | 11.0%(+20.8)#778 |
| 11. | Amagansett | 31.5% | 10.9%(+20.6)#11 | 11.0%(+20.4)#799 |
| 12. | Lawrence | 31.4% | 10.9%(+20.6)#12 | 11.0%(+20.4)#801 |
| 13. | Cove Neck | 31.3% | 10.9%(+20.4)#13 | 11.0%(+20.3)#810 |
| 14. | Winthrop | 30.4% | 10.9%(+19.5)#14 | 11.0%(+19.4)#869 |
| 15. | Katonah | 30.2% | 10.9%(+19.4)#15 | 11.0%(+19.2)#890 |
| 16. | Plandome | 29.9% | 10.9%(+19.0)#16 | 11.0%(+18.9)#912 |
| 17. | Pelham Manor | 29.5% | 10.9%(+18.6)#17 | 11.0%(+18.5)#935 |
| 18. | Barryville | 29.4% | 10.9%(+18.5)#18 | 11.0%(+18.4)#952 |
| 19. | Grand View On Hudson | 28.7% | 10.9%(+17.9)#19 | 11.0%(+17.7)#999 |
| 20. | Clifton Knolls-Mill Creek | 28.4% | 10.9%(+17.5)#20 | 11.0%(+17.4)#1,040 |
| 21. | Mount Vision | 28.3% | 10.9%(+17.5)#21 | 11.0%(+17.3)#1,052 |
| 22. | Asharoken | 28.2% | 10.9%(+17.3)#22 | 11.0%(+17.2)#1,073 |
| 23. | Crompond | 27.9% | 10.9%(+17.0)#23 | 11.0%(+16.9)#1,104 |
| 24. | Rye | 27.3% | 10.9%(+16.5)#24 | 11.0%(+16.3)#1,152 |
| 25. | Cold Spring Harbor | 26.9% | 10.9%(+16.0)#25 | 11.0%(+15.9)#1,213 |
| 26. | Golden S Bridge | 26.8% | 10.9%(+16.0)#26 | 11.0%(+15.8)#1,222 |
| 27. | Gardiner | 26.5% | 10.9%(+15.6)#27 | 11.0%(+15.5)#1,269 |
| 28. | Flower Hill | 26.5% | 10.9%(+15.6)#28 | 11.0%(+15.5)#1,273 |
| 29. | Lloyd Harbor | 26.4% | 10.9%(+15.5)#29 | 11.0%(+15.4)#1,284 |
| 30. | Centre Island | 26.1% | 10.9%(+15.2)#30 | 11.0%(+15.1)#1,326 |
| 31. | Candor | 26.0% | 10.9%(+15.1)#31 | 11.0%(+15.0)#1,345 |
| 32. | Saddle Rock | 26.0% | 10.9%(+15.1)#32 | 11.0%(+14.9)#1,350 |
| 33. | Downsville | 26.0% | 10.9%(+15.1)#33 | 11.0%(+14.9)#1,353 |
| 34. | Crystal Beach | 25.9% | 10.9%(+15.0)#34 | 11.0%(+14.9)#1,356 |
| 35. | Chadwicks | 25.8% | 10.9%(+14.9)#35 | 11.0%(+14.8)#1,373 |
| 36. | Lake Katrine | 25.7% | 10.9%(+14.9)#36 | 11.0%(+14.7)#1,383 |
| 37. | Conesus Lake | 25.5% | 10.9%(+14.7)#37 | 11.0%(+14.5)#1,422 |
| 38. | Northville | 25.2% | 10.9%(+14.3)#38 | 11.0%(+14.2)#1,470 |
| 39. | Fowlerville | 25.0% | 10.9%(+14.1)#39 | 11.0%(+14.0)#1,496 |
| 40. | Duane Lake | 25.0% | 10.9%(+14.1)#40 | 11.0%(+14.0)#1,498 |
| 41. | Old Field | 24.9% | 10.9%(+14.0)#41 | 11.0%(+13.8)#1,546 |
| 42. | Wassaic | 24.8% | 10.9%(+13.9)#42 | 11.0%(+13.8)#1,551 |
| 43. | Skaneateles | 24.7% | 10.9%(+13.9)#43 | 11.0%(+13.7)#1,564 |
| 44. | Armonk | 24.4% | 10.9%(+13.5)#44 | 11.0%(+13.4)#1,628 |
| 45. | Woodsburgh | 24.3% | 10.9%(+13.4)#45 | 11.0%(+13.3)#1,643 |
| 46. | Sharon Springs | 24.2% | 10.9%(+13.3)#46 | 11.0%(+13.2)#1,669 |
| 47. | Locust Valley | 24.1% | 10.9%(+13.2)#47 | 11.0%(+13.1)#1,683 |
| 48. | Hunter | 24.0% | 10.9%(+13.1)#48 | 11.0%(+13.0)#1,719 |
| 49. | Roslyn Estates | 23.8% | 10.9%(+13.0)#49 | 11.0%(+12.8)#1,742 |
| 50. | Palenville | 23.6% | 10.9%(+12.7)#50 | 11.0%(+12.6)#1,785 |
| 51. | Mountain Dale | 23.6% | 10.9%(+12.7)#51 | 11.0%(+12.6)#1,789 |
| 52. | Taconic Shores | 23.5% | 10.9%(+12.7)#52 | 11.0%(+12.5)#1,800 |
| 53. | Mayville | 23.5% | 10.9%(+12.6)#53 | 11.0%(+12.5)#1,813 |
| 54. | New Hamburg | 23.4% | 10.9%(+12.6)#54 | 11.0%(+12.4)#1,828 |
| 55. | Sands Point | 23.4% | 10.9%(+12.5)#55 | 11.0%(+12.3)#1,834 |
| 56. | Willsboro Point | 23.4% | 10.9%(+12.5)#56 | 11.0%(+12.3)#1,835 |
| 57. | Baiting Hollow | 23.3% | 10.9%(+12.4)#57 | 11.0%(+12.3)#1,861 |
| 58. | East Avon | 23.1% | 10.9%(+12.2)#58 | 11.0%(+12.1)#1,898 |
| 59. | Windham | 23.1% | 10.9%(+12.2)#59 | 11.0%(+12.1)#1,901 |
| 60. | Sleepy Hollow Lake | 22.9% | 10.9%(+12.0)#60 | 11.0%(+11.9)#1,940 |
| 61. | Russell Gardens | 22.8% | 10.9%(+11.9)#61 | 11.0%(+11.8)#1,957 |
| 62. | Macdonnell Heights | 22.7% | 10.9%(+11.8)#62 | 11.0%(+11.7)#1,982 |
| 63. | Swan Lake | 22.7% | 10.9%(+11.8)#63 | 11.0%(+11.7)#1,985 |
| 64. | Water Mill | 22.5% | 10.9%(+11.6)#64 | 11.0%(+11.4)#2,035 |
| 65. | Southampton | 22.4% | 10.9%(+11.5)#65 | 11.0%(+11.4)#2,045 |
| 66. | Coxsackie | 22.3% | 10.9%(+11.4)#66 | 11.0%(+11.3)#2,061 |
| 67. | Cherry Creek | 22.2% | 10.9%(+11.3)#67 | 11.0%(+11.2)#2,072 |
| 68. | Viola | 22.2% | 10.9%(+11.3)#68 | 11.0%(+11.1)#2,095 |
| 69. | Cutchogue | 21.9% | 10.9%(+11.0)#69 | 11.0%(+10.9)#2,161 |
| 70. | Pleasantville | 21.9% | 10.9%(+11.0)#70 | 11.0%(+10.8)#2,172 |
| 71. | Upper Brookville | 21.8% | 10.9%(+10.9)#71 | 11.0%(+10.7)#2,199 |
| 72. | Kensington | 21.6% | 10.9%(+10.8)#72 | 11.0%(+10.6)#2,229 |
| 73. | Lincolndale | 21.6% | 10.9%(+10.8)#73 | 11.0%(+10.6)#2,236 |
| 74. | Thomaston | 21.4% | 10.9%(+10.5)#74 | 11.0%(+10.3)#2,307 |
| 75. | Plandome Heights | 21.3% | 10.9%(+10.4)#75 | 11.0%(+10.3)#2,317 |
| 76. | Dix Hills | 21.3% | 10.9%(+10.4)#76 | 11.0%(+10.3)#2,335 |
| 77. | Byersville | 21.2% | 10.9%(+10.3)#77 | 11.0%(+10.2)#2,365 |
| 78. | Tuscarora | 21.2% | 10.9%(+10.3)#78 | 11.0%(+10.1)#2,378 |
| 79. | Crest View Heights | 21.1% | 10.9%(+10.2)#79 | 11.0%(+10.1)#2,386 |
| 80. | Three Mile Bay | 21.1% | 10.9%(+10.2)#80 | 11.0%(+10.0)#2,406 |
| 81. | Scarsdale | 21.0% | 10.9%(+10.1)#81 | 11.0%(+10.00)#2,415 |
| 82. | Hewlett Neck | 21.0% | 10.9%(+10.1)#82 | 11.0%(+9.98)#2,425 |
| 83. | Unadilla Forks | 20.9% | 10.9%(+10.0)#83 | 11.0%(+9.91)#2,441 |
| 84. | Copake Lake | 20.8% | 10.9%(+9.94)#84 | 11.0%(+9.80)#2,479 |
| 85. | Gilbertsville | 20.7% | 10.9%(+9.83)#85 | 11.0%(+9.69)#2,512 |
| 86. | Bronxville | 20.7% | 10.9%(+9.78)#86 | 11.0%(+9.64)#2,531 |
| 87. | Jericho | 20.6% | 10.9%(+9.77)#87 | 11.0%(+9.63)#2,536 |
| 88. | Larchmont | 20.6% | 10.9%(+9.69)#88 | 11.0%(+9.55)#2,557 |
| 89. | Freeville | 20.5% | 10.9%(+9.65)#89 | 11.0%(+9.52)#2,566 |
| 90. | Greenville Cdp Westchester County | 20.5% | 10.9%(+9.65)#90 | 11.0%(+9.51)#2,569 |
| 91. | Altamont | 20.5% | 10.9%(+9.65)#91 | 11.0%(+9.51)#2,570 |
| 92. | South Fallsburg | 20.5% | 10.9%(+9.64)#92 | 11.0%(+9.50)#2,572 |
| 93. | Montauk | 20.4% | 10.9%(+9.56)#93 | 11.0%(+9.43)#2,595 |
| 94. | Oyster Bay Cove | 20.3% | 10.9%(+9.41)#94 | 11.0%(+9.27)#2,644 |
| 95. | Port Washington North | 20.2% | 10.9%(+9.34)#95 | 11.0%(+9.21)#2,667 |
| 96. | Huntington Bay | 20.2% | 10.9%(+9.33)#96 | 11.0%(+9.19)#2,671 |
| 97. | Port Leyden | 20.2% | 10.9%(+9.32)#97 | 11.0%(+9.18)#2,675 |
| 98. | Copake | 20.0% | 10.9%(+9.12)#98 | 11.0%(+8.98)#2,735 |
| 99. | Hunt | 20.0% | 10.9%(+9.12)#99 | 11.0%(+8.98)#2,753 |
| 100. | Old Bethpage | 20.0% | 10.9%(+9.11)#100 | 11.0%(+8.97)#2,779 |
Common Questions
What are the Top 10 Cities with the Highest Percentage of Population Employed in Management in New York?
Top 10 Cities with the Highest Percentage of Population Employed in Management in New York are:
#1
100.0%
#2
51.3%
#3
50.9%
#4
40.4%
#5
37.5%
#6
32.9%
#7
32.3%
#8
31.8%
#9
31.5%
#10
31.4%
What city has the Highest Percentage of Population Employed in Management in New York?
Saltaire has the Highest Percentage of Population Employed in Management in New York with 100.0%.
What is the Percentage of Population Employed in Management in the State of New York?
Percentage of Population Employed in Management in New York is 10.9%.
What is the Percentage of Population Employed in Management in the United States?
Percentage of Population Employed in Management in the United States is 11.0%.