Cities with the Highest Percentage of Population Employed in Management in Connecticut
RELATED REPORTS & OPTIONS
Management
Connecticut
Compare Cities
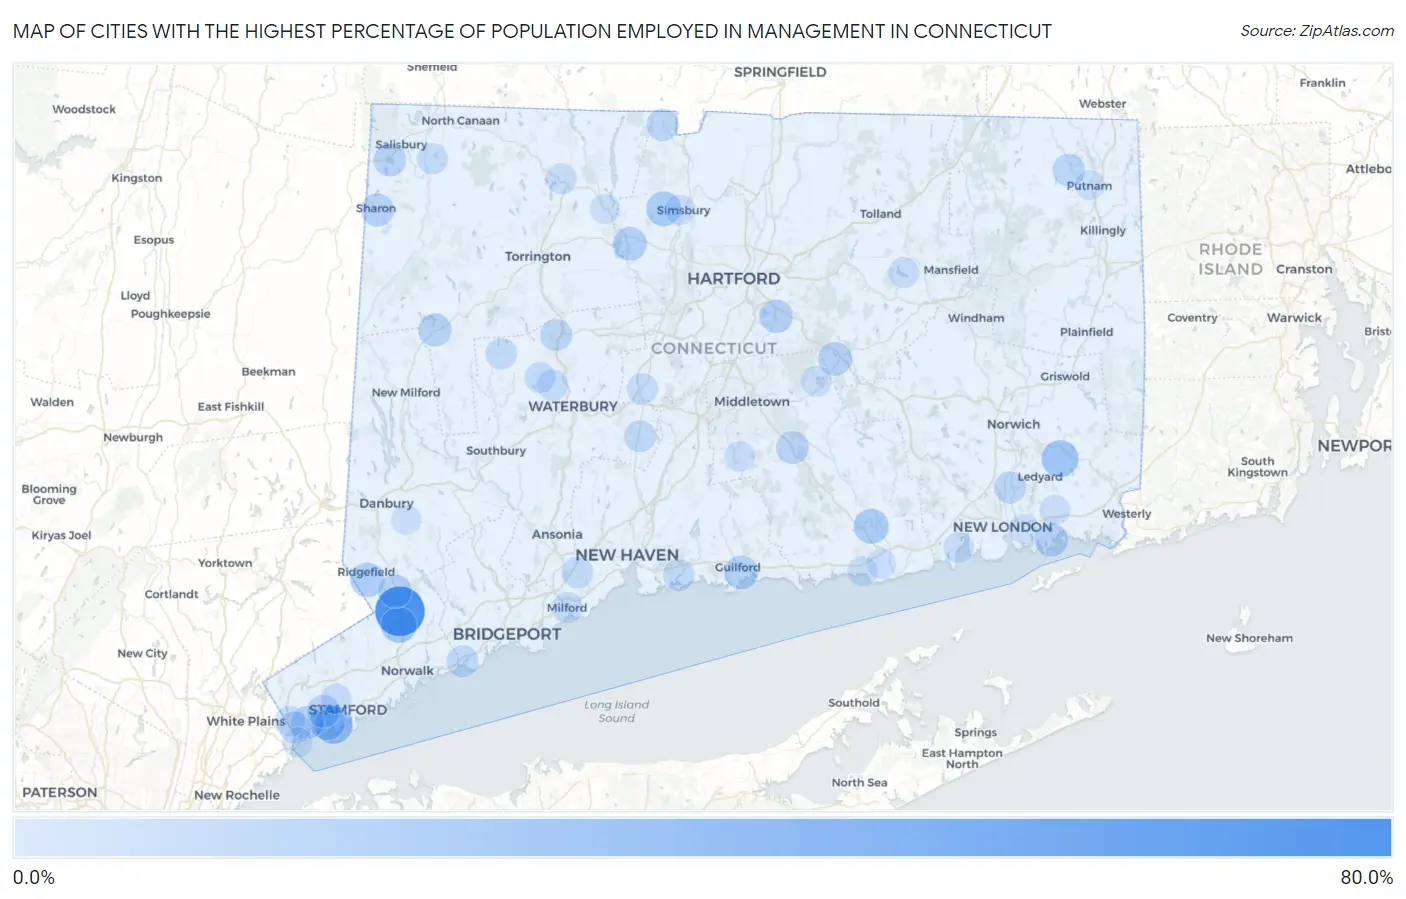
Map of Cities with the Highest Percentage of Population Employed in Management in Connecticut
0.0%
80.0%
Cities with the Highest Percentage of Population Employed in Management in Connecticut
| City | % Employed | vs State | vs National | |
| 1. | Cannondale | 66.8% | 12.1%(+54.8)#1 | 11.0%(+55.8)#114 |
| 2. | Sail Harbor | 62.2% | 12.1%(+50.1)#2 | 11.0%(+51.1)#137 |
| 3. | Fenwick Borough | 47.1% | 12.1%(+35.0)#3 | 11.0%(+36.0)#297 |
| 4. | Indian Field | 39.9% | 12.1%(+27.8)#4 | 11.0%(+28.9)#444 |
| 5. | Candlewood Isle | 36.0% | 12.1%(+23.9)#5 | 11.0%(+25.0)#563 |
| 6. | Tokeneke | 35.6% | 12.1%(+23.5)#6 | 11.0%(+24.6)#587 |
| 7. | Old Greenwich | 33.5% | 12.1%(+21.4)#7 | 11.0%(+22.5)#666 |
| 8. | Weston | 33.0% | 12.1%(+20.9)#8 | 11.0%(+21.9)#714 |
| 9. | Redding Center | 32.4% | 12.1%(+20.3)#9 | 11.0%(+21.4)#752 |
| 10. | Poplar Plains | 32.3% | 12.1%(+20.2)#10 | 11.0%(+21.3)#758 |
| 11. | Old Hill | 31.9% | 12.1%(+19.8)#11 | 11.0%(+20.8)#777 |
| 12. | Mashantucket | 31.0% | 12.1%(+18.9)#12 | 11.0%(+19.9)#834 |
| 13. | Bridgewater | 30.6% | 12.1%(+18.5)#13 | 11.0%(+19.5)#859 |
| 14. | Murray | 29.7% | 12.1%(+17.6)#14 | 11.0%(+18.7)#921 |
| 15. | Rock Ridge | 28.6% | 12.1%(+16.5)#15 | 11.0%(+17.6)#1,011 |
| 16. | Mill Plain | 28.5% | 12.1%(+16.4)#16 | 11.0%(+17.5)#1,034 |
| 17. | Wilton Center | 27.9% | 12.1%(+15.8)#17 | 11.0%(+16.8)#1,105 |
| 18. | West Mountain | 27.1% | 12.1%(+15.0)#18 | 11.0%(+16.1)#1,179 |
| 19. | Brookfield Center | 27.0% | 12.1%(+14.9)#19 | 11.0%(+16.0)#1,200 |
| 20. | Riverside | 26.8% | 12.1%(+14.7)#20 | 11.0%(+15.8)#1,227 |
| 21. | Stonington Borough | 26.5% | 12.1%(+14.4)#21 | 11.0%(+15.5)#1,272 |
| 22. | Compo | 26.5% | 12.1%(+14.4)#22 | 11.0%(+15.4)#1,278 |
| 23. | Mamanasco Lake | 25.5% | 12.1%(+13.4)#23 | 11.0%(+14.5)#1,427 |
| 24. | Essex Village | 25.5% | 12.1%(+13.4)#24 | 11.0%(+14.5)#1,432 |
| 25. | Tashua | 25.1% | 12.1%(+13.0)#25 | 11.0%(+14.1)#1,477 |
| 26. | West Simsbury | 24.9% | 12.1%(+12.8)#26 | 11.0%(+13.9)#1,537 |
| 27. | Oronoque | 24.0% | 12.1%(+12.0)#27 | 11.0%(+13.0)#1,700 |
| 28. | Litchfield Borough | 24.0% | 12.1%(+11.9)#28 | 11.0%(+13.0)#1,705 |
| 29. | Plattsville | 24.0% | 12.1%(+11.9)#29 | 11.0%(+13.0)#1,706 |
| 30. | Noroton | 23.9% | 12.1%(+11.8)#30 | 11.0%(+12.9)#1,727 |
| 31. | Ridgefield | 23.8% | 12.1%(+11.7)#31 | 11.0%(+12.8)#1,741 |
| 32. | Groton Long Point Borough | 23.8% | 12.1%(+11.7)#32 | 11.0%(+12.8)#1,743 |
| 33. | Hawleyville | 23.7% | 12.1%(+11.6)#33 | 11.0%(+12.7)#1,773 |
| 34. | Candlewood Knolls | 23.6% | 12.1%(+11.5)#34 | 11.0%(+12.6)#1,790 |
| 35. | Noroton Heights | 23.1% | 12.1%(+11.0)#35 | 11.0%(+12.1)#1,897 |
| 36. | Staples | 22.9% | 12.1%(+10.8)#36 | 11.0%(+11.9)#1,936 |
| 37. | Guilford Center | 22.6% | 12.1%(+10.5)#37 | 11.0%(+11.6)#2,008 |
| 38. | Saugatuck | 22.6% | 12.1%(+10.5)#38 | 11.0%(+11.5)#2,014 |
| 39. | Collinsville | 22.5% | 12.1%(+10.4)#39 | 11.0%(+11.5)#2,021 |
| 40. | Terramuggus | 22.1% | 12.1%(+10.0)#40 | 11.0%(+11.1)#2,107 |
| 41. | Glastonbury Center | 21.8% | 12.1%(+9.70)#41 | 11.0%(+10.8)#2,192 |
| 42. | Georgetown | 21.7% | 12.1%(+9.60)#42 | 11.0%(+10.7)#2,218 |
| 43. | Lakes West | 21.1% | 12.1%(+9.00)#43 | 11.0%(+10.1)#2,388 |
| 44. | Westport | 20.8% | 12.1%(+8.75)#44 | 11.0%(+9.82)#2,464 |
| 45. | Noank | 20.8% | 12.1%(+8.69)#45 | 11.0%(+9.77)#2,490 |
| 46. | Cos Cob | 20.6% | 12.1%(+8.54)#46 | 11.0%(+9.61)#2,542 |
| 47. | Sharon | 20.6% | 12.1%(+8.51)#47 | 11.0%(+9.58)#2,548 |
| 48. | Greenwich | 20.5% | 12.1%(+8.45)#48 | 11.0%(+9.53)#2,564 |
| 49. | New Preston | 20.5% | 12.1%(+8.44)#49 | 11.0%(+9.51)#2,568 |
| 50. | Lordship | 20.5% | 12.1%(+8.40)#50 | 11.0%(+9.48)#2,580 |
| 51. | Higganum | 20.1% | 12.1%(+7.97)#51 | 11.0%(+9.04)#2,714 |
| 52. | Lakeville | 19.9% | 12.1%(+7.83)#52 | 11.0%(+8.90)#2,798 |
| 53. | Lakes East | 19.7% | 12.1%(+7.65)#53 | 11.0%(+8.73)#2,853 |
| 54. | Coleytown | 19.5% | 12.1%(+7.39)#54 | 11.0%(+8.46)#2,943 |
| 55. | Newtown Borough | 19.5% | 12.1%(+7.36)#55 | 11.0%(+8.44)#2,955 |
| 56. | South Woodstock | 19.4% | 12.1%(+7.32)#56 | 11.0%(+8.39)#2,977 |
| 57. | Daniels Farm | 19.0% | 12.1%(+6.90)#57 | 11.0%(+7.98)#3,144 |
| 58. | Sandy Hook | 18.8% | 12.1%(+6.70)#58 | 11.0%(+7.77)#3,222 |
| 59. | Woodmont Borough | 18.7% | 12.1%(+6.59)#59 | 11.0%(+7.66)#3,268 |
| 60. | Darien Downtown | 18.6% | 12.1%(+6.52)#60 | 11.0%(+7.59)#3,303 |
| 61. | Greens Farms | 18.6% | 12.1%(+6.46)#61 | 11.0%(+7.54)#3,336 |
| 62. | Gales Ferry | 18.3% | 12.1%(+6.18)#62 | 11.0%(+7.26)#3,487 |
| 63. | North Granby | 18.2% | 12.1%(+6.14)#63 | 11.0%(+7.21)#3,503 |
| 64. | East | 18.2% | 12.1%(+6.11)#64 | 11.0%(+7.18)#3,515 |
| 65. | Thomaston | 17.9% | 12.1%(+5.83)#65 | 11.0%(+6.90)#3,663 |
| 66. | New Canaan | 17.8% | 12.1%(+5.67)#66 | 11.0%(+6.74)#3,748 |
| 67. | Pemberwick | 17.6% | 12.1%(+5.49)#67 | 11.0%(+6.56)#3,851 |
| 68. | Cheshire Village | 17.3% | 12.1%(+5.23)#68 | 11.0%(+6.30)#3,998 |
| 69. | Southport | 17.3% | 12.1%(+5.22)#69 | 11.0%(+6.29)#4,001 |
| 70. | Cornwall | 17.1% | 12.1%(+5.05)#70 | 11.0%(+6.12)#4,122 |
| 71. | Orange | 16.5% | 12.1%(+4.44)#71 | 11.0%(+5.51)#4,480 |
| 72. | Branford Center | 16.4% | 12.1%(+4.33)#72 | 11.0%(+5.40)#4,547 |
| 73. | Candlewood Shores | 16.4% | 12.1%(+4.26)#73 | 11.0%(+5.33)#4,584 |
| 74. | South Wilton | 16.0% | 12.1%(+3.89)#74 | 11.0%(+4.97)#4,828 |
| 75. | Bethlehem Village | 16.0% | 12.1%(+3.87)#75 | 11.0%(+4.94)#4,843 |
| 76. | Oakville | 15.7% | 12.1%(+3.61)#76 | 11.0%(+4.69)#5,050 |
| 77. | Falls Village | 15.5% | 12.1%(+3.43)#77 | 11.0%(+4.51)#5,209 |
| 78. | Plantsville | 15.5% | 12.1%(+3.38)#78 | 11.0%(+4.45)#5,249 |
| 79. | Milford City Balance | 15.4% | 12.1%(+3.33)#79 | 11.0%(+4.40)#5,288 |
| 80. | Cornwall Bridge | 15.3% | 12.1%(+3.21)#80 | 11.0%(+4.29)#5,394 |
| 81. | Watertown | 15.2% | 12.1%(+3.14)#81 | 11.0%(+4.22)#5,454 |
| 82. | Stepney | 15.0% | 12.1%(+2.95)#82 | 11.0%(+4.02)#5,606 |
| 83. | Glenville | 14.9% | 12.1%(+2.82)#83 | 11.0%(+3.89)#5,704 |
| 84. | Winsted | 14.7% | 12.1%(+2.62)#84 | 11.0%(+3.69)#5,864 |
| 85. | South Coventry | 14.3% | 12.1%(+2.24)#85 | 11.0%(+3.32)#6,200 |
| 86. | Lakeside Woods | 14.1% | 12.1%(+1.97)#86 | 11.0%(+3.04)#6,478 |
| 87. | Simsbury Center | 13.9% | 12.1%(+1.85)#87 | 11.0%(+2.93)#6,583 |
| 88. | Niantic | 13.9% | 12.1%(+1.78)#88 | 11.0%(+2.85)#6,657 |
| 89. | Lake Pocotopaug | 13.9% | 12.1%(+1.78)#89 | 11.0%(+2.85)#6,659 |
| 90. | Durham | 13.8% | 12.1%(+1.68)#90 | 11.0%(+2.75)#6,752 |
| 91. | Pleasant Valley | 13.6% | 12.1%(+1.51)#91 | 11.0%(+2.58)#6,915 |
| 92. | Stamford | 13.4% | 12.1%(+1.35)#92 | 11.0%(+2.42)#7,099 |
| 93. | Saybrook Manor | 13.4% | 12.1%(+1.28)#93 | 11.0%(+2.35)#7,180 |
| 94. | Old Mystic | 13.2% | 12.1%(+1.08)#94 | 11.0%(+2.15)#7,390 |
| 95. | Byram | 13.1% | 12.1%(+0.996)#95 | 11.0%(+2.07)#7,451 |
| 96. | Putnam | 13.0% | 12.1%(+0.893)#96 | 11.0%(+1.97)#7,589 |
| 97. | New Hartford Center | 12.9% | 12.1%(+0.794)#97 | 11.0%(+1.87)#7,700 |
| 98. | Old Saybrook Center | 12.8% | 12.1%(+0.728)#98 | 11.0%(+1.80)#7,767 |
| 99. | Bethel | 12.8% | 12.1%(+0.687)#99 | 11.0%(+1.76)#7,820 |
| 100. | Long Hill | 12.7% | 12.1%(+0.591)#100 | 11.0%(+1.66)#7,926 |
Common Questions
What are the Top 10 Cities with the Highest Percentage of Population Employed in Management in Connecticut?
Top 10 Cities with the Highest Percentage of Population Employed in Management in Connecticut are:
#1
66.8%
#2
33.5%
#3
31.0%
#4
27.9%
#5
26.8%
#6
25.5%
#7
24.9%
#8
23.8%
#9
22.6%
#10
22.5%
What city has the Highest Percentage of Population Employed in Management in Connecticut?
Cannondale has the Highest Percentage of Population Employed in Management in Connecticut with 66.8%.
What is the Percentage of Population Employed in Management in the State of Connecticut?
Percentage of Population Employed in Management in Connecticut is 12.1%.
What is the Percentage of Population Employed in Management in the United States?
Percentage of Population Employed in Management in the United States is 11.0%.