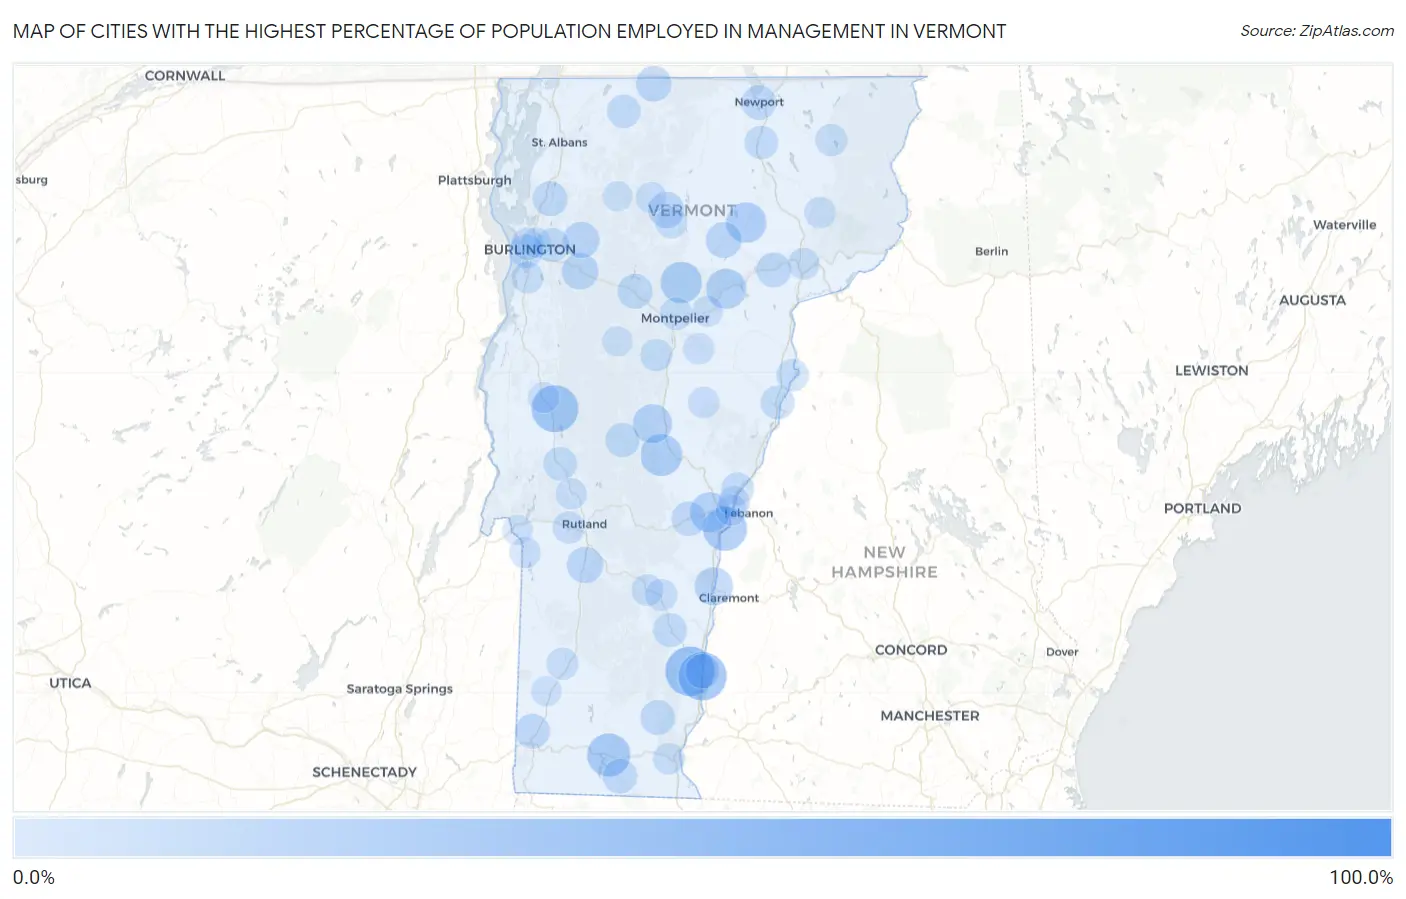
Cities with the Highest Percentage of Population Employed in Management in Vermont
RELATED REPORTS & OPTIONS
Management
Vermont
Compare Cities
Map of Cities with the Highest Percentage of Population Employed in Management in Vermont
0.0%
100.0%
Cities with the Highest Percentage of Population Employed in Management in Vermont
| City | % Employed | vs State | vs National | |
| 1. | Highgate Springs | 100.0% | 12.3%(+87.7)#1 | 11.0%(+89.0)#74 |
| 2. | South Woodstock | 58.3% | 12.3%(+46.0)#2 | 11.0%(+47.3)#164 |
| 3. | Waterbury Center | 43.3% | 12.3%(+31.0)#3 | 11.0%(+32.3)#359 |
| 4. | Saxtons River | 41.6% | 12.3%(+29.3)#4 | 11.0%(+30.5)#402 |
| 5. | North Westminster | 39.3% | 12.3%(+27.0)#5 | 11.0%(+28.3)#457 |
| 6. | Underhill Center | 37.5% | 12.3%(+25.2)#6 | 11.0%(+26.5)#505 |
| 7. | East Middlebury | 37.1% | 12.3%(+24.8)#7 | 11.0%(+26.0)#517 |
| 8. | Stratton Mountain | 33.3% | 12.3%(+21.0)#8 | 11.0%(+22.3)#681 |
| 9. | Weston | 33.3% | 12.3%(+21.0)#9 | 11.0%(+22.3)#686 |
| 10. | North Hartland | 31.9% | 12.3%(+19.6)#10 | 11.0%(+20.9)#774 |
| 11. | Wilmington | 30.4% | 12.3%(+18.1)#11 | 11.0%(+19.4)#863 |
| 12. | Peacham | 30.2% | 12.3%(+17.9)#12 | 11.0%(+19.1)#898 |
| 13. | Bethel | 28.1% | 12.3%(+15.8)#13 | 11.0%(+17.1)#1,080 |
| 14. | Worcester | 27.0% | 12.3%(+14.7)#14 | 11.0%(+16.0)#1,194 |
| 15. | Wardsboro | 25.5% | 12.3%(+13.2)#15 | 11.0%(+14.5)#1,424 |
| 16. | Greensboro Bend | 25.2% | 12.3%(+12.9)#16 | 11.0%(+14.2)#1,472 |
| 17. | Quechee | 25.0% | 12.3%(+12.7)#17 | 11.0%(+14.0)#1,491 |
| 18. | Jamaica | 25.0% | 12.3%(+12.7)#18 | 11.0%(+14.0)#1,513 |
| 19. | Marshfield | 24.9% | 12.3%(+12.6)#19 | 11.0%(+13.8)#1,544 |
| 20. | Bolton Valley | 24.1% | 12.3%(+11.8)#20 | 11.0%(+13.0)#1,693 |
| 21. | Randolph | 23.1% | 12.3%(+10.9)#21 | 11.0%(+12.1)#1,878 |
| 22. | East Dorset | 22.5% | 12.3%(+10.2)#22 | 11.0%(+11.5)#2,031 |
| 23. | Ascutney | 21.5% | 12.3%(+9.23)#23 | 11.0%(+10.5)#2,259 |
| 24. | Pownal Center | 20.8% | 12.3%(+8.48)#24 | 11.0%(+9.76)#2,495 |
| 25. | Bakersfield | 19.8% | 12.3%(+7.53)#25 | 11.0%(+8.81)#2,823 |
| 26. | West Charlotte | 19.4% | 12.3%(+7.08)#26 | 11.0%(+8.36)#2,992 |
| 27. | Richmond | 18.6% | 12.3%(+6.32)#27 | 11.0%(+7.59)#3,301 |
| 28. | Underhill Flats | 18.4% | 12.3%(+6.07)#28 | 11.0%(+7.34)#3,433 |
| 29. | Hyde Park | 18.3% | 12.3%(+6.01)#29 | 11.0%(+7.29)#3,465 |
| 30. | Jericho | 18.2% | 12.3%(+5.93)#30 | 11.0%(+7.20)#3,508 |
| 31. | Wallingford | 18.2% | 12.3%(+5.89)#31 | 11.0%(+7.16)#3,523 |
| 32. | Algiers | 17.7% | 12.3%(+5.43)#32 | 11.0%(+6.71)#3,768 |
| 33. | Hardwick | 17.5% | 12.3%(+5.22)#33 | 11.0%(+6.50)#3,889 |
| 34. | Richford | 16.6% | 12.3%(+4.34)#34 | 11.0%(+5.62)#4,426 |
| 35. | Huntington | 16.4% | 12.3%(+4.08)#35 | 11.0%(+5.36)#4,568 |
| 36. | Newfane | 15.8% | 12.3%(+3.49)#36 | 11.0%(+4.77)#4,968 |
| 37. | Waterbury | 15.7% | 12.3%(+3.38)#37 | 11.0%(+4.66)#5,079 |
| 38. | Danville | 15.6% | 12.3%(+3.33)#38 | 11.0%(+4.61)#5,120 |
| 39. | Milton | 15.6% | 12.3%(+3.30)#39 | 11.0%(+4.58)#5,144 |
| 40. | South Shaftsbury | 15.6% | 12.3%(+3.29)#40 | 11.0%(+4.57)#5,151 |
| 41. | Woodstock | 15.3% | 12.3%(+2.98)#41 | 11.0%(+4.26)#5,418 |
| 42. | Newport | 15.3% | 12.3%(+2.97)#42 | 11.0%(+4.24)#5,433 |
| 43. | Bellows Falls | 15.1% | 12.3%(+2.84)#43 | 11.0%(+4.12)#5,523 |
| 44. | Jacksonville | 15.1% | 12.3%(+2.76)#44 | 11.0%(+4.03)#5,599 |
| 45. | Bolton | 15.0% | 12.3%(+2.70)#45 | 11.0%(+3.98)#5,636 |
| 46. | Stamford | 14.8% | 12.3%(+2.53)#46 | 11.0%(+3.81)#5,772 |
| 47. | Rochester | 14.6% | 12.3%(+2.27)#47 | 11.0%(+3.54)#5,992 |
| 48. | Pawlet | 14.3% | 12.3%(+1.99)#48 | 11.0%(+3.27)#6,244 |
| 49. | Essex Junction | 14.2% | 12.3%(+1.92)#49 | 11.0%(+3.20)#6,341 |
| 50. | Chester | 14.1% | 12.3%(+1.77)#50 | 11.0%(+3.05)#6,473 |
| 51. | South Londonderry | 14.0% | 12.3%(+1.68)#51 | 11.0%(+2.96)#6,553 |
| 52. | South Burlington | 13.8% | 12.3%(+1.46)#52 | 11.0%(+2.73)#6,772 |
| 53. | Bradford | 13.7% | 12.3%(+1.41)#53 | 11.0%(+2.69)#6,816 |
| 54. | Brandon | 13.4% | 12.3%(+1.10)#54 | 11.0%(+2.38)#7,148 |
| 55. | St. George | 13.4% | 12.3%(+1.10)#55 | 11.0%(+2.38)#7,149 |
| 56. | Pownal | 13.1% | 12.3%(+0.775)#56 | 11.0%(+2.05)#7,472 |
| 57. | Enosburg Falls | 13.0% | 12.3%(+0.727)#57 | 11.0%(+2.00)#7,535 |
| 58. | Orleans | 13.0% | 12.3%(+0.701)#58 | 11.0%(+1.98)#7,570 |
| 59. | Lincoln | 12.2% | 12.3%(-0.101)#59 | 11.0%(+1.18)#8,568 |
| 60. | Norwich | 12.1% | 12.3%(-0.223)#60 | 11.0%(+1.05)#8,727 |
| 61. | Montpelier | 11.8% | 12.3%(-0.491)#61 | 11.0%(+0.785)#9,096 |
| 62. | Gilman | 11.6% | 12.3%(-0.669)#62 | 11.0%(+0.608)#9,366 |
| 63. | Newbury | 11.4% | 12.3%(-0.945)#63 | 11.0%(+0.332)#9,785 |
| 64. | Burlington | 11.3% | 12.3%(-0.960)#64 | 11.0%(+0.316)#9,808 |
| 65. | Northfield | 11.3% | 12.3%(-1.03)#65 | 11.0%(+0.246)#9,917 |
| 66. | Grafton | 11.1% | 12.3%(-1.19)#66 | 11.0%(+0.091)#10,171 |
| 67. | Island Pond | 11.1% | 12.3%(-1.22)#67 | 11.0%(+0.056)#10,219 |
| 68. | Manchester | 10.9% | 12.3%(-1.39)#68 | 11.0%(-0.111)#10,461 |
| 69. | West Rutland | 10.8% | 12.3%(-1.45)#69 | 11.0%(-0.174)#10,559 |
| 70. | Shelburne | 10.7% | 12.3%(-1.57)#70 | 11.0%(-0.292)#10,729 |
| 71. | Proctorsville | 10.7% | 12.3%(-1.62)#71 | 11.0%(-0.340)#10,810 |
| 72. | Morrisville | 10.4% | 12.3%(-1.88)#72 | 11.0%(-0.602)#11,243 |
| 73. | St Johnsbury | 10.0% | 12.3%(-2.33)#73 | 11.0%(-1.05)#12,028 |
| 74. | West Brattleboro | 10.0% | 12.3%(-2.34)#74 | 11.0%(-1.06)#12,043 |
| 75. | Ludlow | 9.9% | 12.3%(-2.37)#75 | 11.0%(-1.10)#12,092 |
| 76. | East Burke | 9.6% | 12.3%(-2.66)#76 | 11.0%(-1.38)#12,625 |
| 77. | Chelsea | 9.6% | 12.3%(-2.67)#77 | 11.0%(-1.39)#12,642 |
| 78. | North Clarendon | 9.6% | 12.3%(-2.70)#78 | 11.0%(-1.42)#12,709 |
| 79. | Lunenburg | 9.4% | 12.3%(-2.85)#79 | 11.0%(-1.57)#12,999 |
| 80. | Killington | 9.4% | 12.3%(-2.87)#80 | 11.0%(-1.59)#13,041 |
| 81. | White River Junction | 9.4% | 12.3%(-2.89)#81 | 11.0%(-1.61)#13,075 |
| 82. | Wilder | 9.2% | 12.3%(-3.08)#82 | 11.0%(-1.81)#13,448 |
| 83. | Websterville | 9.2% | 12.3%(-3.15)#83 | 11.0%(-1.87)#13,575 |
| 84. | Plainfield | 9.1% | 12.3%(-3.17)#84 | 11.0%(-1.89)#13,605 |
| 85. | Pittsford | 9.1% | 12.3%(-3.21)#85 | 11.0%(-1.93)#13,666 |
| 86. | Poultney | 9.0% | 12.3%(-3.28)#86 | 11.0%(-2.01)#13,858 |
| 87. | Middlebury | 9.0% | 12.3%(-3.35)#87 | 11.0%(-2.07)#13,983 |
| 88. | East Poultney | 8.7% | 12.3%(-3.60)#88 | 11.0%(-2.32)#14,513 |
| 89. | Johnson | 8.7% | 12.3%(-3.63)#89 | 11.0%(-2.36)#14,571 |
| 90. | North Pownal | 8.6% | 12.3%(-3.66)#90 | 11.0%(-2.39)#14,638 |
| 91. | West Pawlet | 8.4% | 12.3%(-3.86)#91 | 11.0%(-2.59)#15,039 |
| 92. | Lyndon | 8.2% | 12.3%(-4.13)#92 | 11.0%(-2.86)#15,572 |
| 93. | Danby | 8.1% | 12.3%(-4.22)#93 | 11.0%(-2.94)#15,749 |
| 94. | Castleton Four Corners | 7.9% | 12.3%(-4.39)#94 | 11.0%(-3.12)#16,134 |
| 95. | Fair Haven | 7.8% | 12.3%(-4.48)#95 | 11.0%(-3.21)#16,316 |
| 96. | Waitsfield | 7.8% | 12.3%(-4.54)#96 | 11.0%(-3.26)#16,421 |
| 97. | Jeffersonville | 7.7% | 12.3%(-4.62)#97 | 11.0%(-3.35)#16,614 |
| 98. | Arlington | 7.6% | 12.3%(-4.69)#98 | 11.0%(-3.41)#16,762 |
| 99. | Westford | 7.5% | 12.3%(-4.77)#99 | 11.0%(-3.49)#16,910 |
| 100. | Winooski | 7.4% | 12.3%(-4.95)#100 | 11.0%(-3.67)#17,287 |
1
2Common Questions
What are the Top 10 Cities with the Highest Percentage of Population Employed in Management in Vermont?
Top 10 Cities with the Highest Percentage of Population Employed in Management in Vermont are:
#1
41.6%
#2
39.3%
#3
37.1%
#4
31.9%
#5
30.4%
#6
28.1%
#7
27.0%
#8
25.2%
#9
25.0%
#10
24.9%
What city has the Highest Percentage of Population Employed in Management in Vermont?
Saxtons River has the Highest Percentage of Population Employed in Management in Vermont with 41.6%.
What is the Percentage of Population Employed in Management in the State of Vermont?
Percentage of Population Employed in Management in Vermont is 12.3%.
What is the Percentage of Population Employed in Management in the United States?
Percentage of Population Employed in Management in the United States is 11.0%.