Cities with the Highest Percentage of Population Employed in Management in Pennsylvania
RELATED REPORTS & OPTIONS
Management
Pennsylvania
Compare Cities
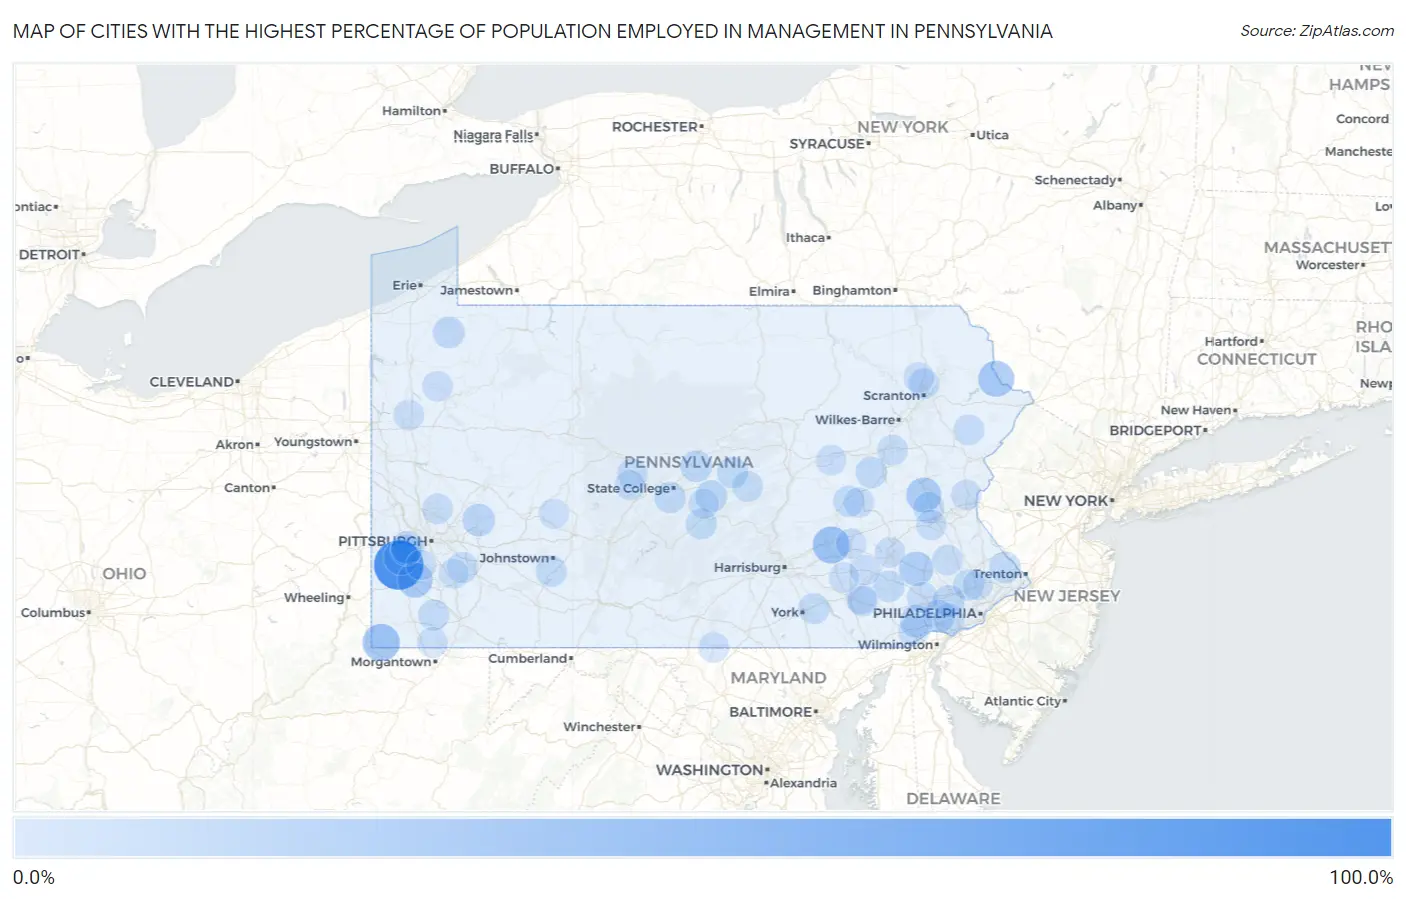
Map of Cities with the Highest Percentage of Population Employed in Management in Pennsylvania
0.0%
100.0%
Cities with the Highest Percentage of Population Employed in Management in Pennsylvania
| City | % Employed | vs State | vs National | |
| 1. | Westland | 100.0% | 10.4%(+89.6)#1 | 11.0%(+89.0)#41 |
| 2. | Canan Station | 100.0% | 10.4%(+89.6)#2 | 11.0%(+89.0)#42 |
| 3. | New Freeport | 47.8% | 10.4%(+37.4)#3 | 11.0%(+36.8)#282 |
| 4. | Jonestown | 47.6% | 10.4%(+37.2)#4 | 11.0%(+36.6)#284 |
| 5. | Pinecroft | 44.5% | 10.4%(+34.1)#5 | 11.0%(+33.5)#337 |
| 6. | Masthope | 43.0% | 10.4%(+32.6)#6 | 11.0%(+32.0)#361 |
| 7. | Cherry Valley Borough | 41.7% | 10.4%(+31.2)#7 | 11.0%(+30.6)#396 |
| 8. | Southview | 40.5% | 10.4%(+30.0)#8 | 11.0%(+29.4)#425 |
| 9. | Eighty Four | 40.1% | 10.4%(+29.7)#9 | 11.0%(+29.1)#431 |
| 10. | Olivia | 39.5% | 10.4%(+29.1)#10 | 11.0%(+28.5)#451 |
| 11. | Slatedale | 39.0% | 10.4%(+28.5)#11 | 11.0%(+27.9)#465 |
| 12. | Blue Knob | 37.5% | 10.4%(+27.1)#12 | 11.0%(+26.5)#506 |
| 13. | Callimont Borough | 36.4% | 10.4%(+25.9)#13 | 11.0%(+25.3)#546 |
| 14. | Douglassville | 36.2% | 10.4%(+25.7)#14 | 11.0%(+25.1)#558 |
| 15. | Gray | 32.9% | 10.4%(+22.4)#15 | 11.0%(+21.8)#724 |
| 16. | Mount Carbon Borough | 31.6% | 10.4%(+21.2)#16 | 11.0%(+20.6)#797 |
| 17. | Pughtown | 30.9% | 10.4%(+20.5)#17 | 11.0%(+19.9)#838 |
| 18. | Glasgow Borough | 30.6% | 10.4%(+20.2)#18 | 11.0%(+19.6)#857 |
| 19. | Noblestown | 29.8% | 10.4%(+19.3)#19 | 11.0%(+18.7)#918 |
| 20. | Oklahoma | 29.2% | 10.4%(+18.8)#20 | 11.0%(+18.2)#962 |
| 21. | Unionville | 28.9% | 10.4%(+18.5)#21 | 11.0%(+17.9)#989 |
| 22. | Ben Avon Heights Borough | 28.5% | 10.4%(+18.1)#22 | 11.0%(+17.5)#1,035 |
| 23. | Thornburg Borough | 28.4% | 10.4%(+18.0)#23 | 11.0%(+17.4)#1,045 |
| 24. | Sewickley Heights Borough | 28.0% | 10.4%(+17.6)#24 | 11.0%(+17.0)#1,092 |
| 25. | Cheyney University | 27.9% | 10.4%(+17.5)#25 | 11.0%(+16.9)#1,098 |
| 26. | Ohiopyle Borough | 27.3% | 10.4%(+16.9)#26 | 11.0%(+16.3)#1,162 |
| 27. | Landingville Borough | 27.2% | 10.4%(+16.8)#27 | 11.0%(+16.2)#1,169 |
| 28. | Berwyn | 26.9% | 10.4%(+16.5)#28 | 11.0%(+15.9)#1,215 |
| 29. | Red Hill | 26.7% | 10.4%(+16.2)#29 | 11.0%(+15.6)#1,247 |
| 30. | Carlisle Barracks | 26.5% | 10.4%(+16.1)#30 | 11.0%(+15.5)#1,275 |
| 31. | Canadohta Lake | 26.4% | 10.4%(+15.9)#31 | 11.0%(+15.3)#1,294 |
| 32. | Smicksburg Borough | 26.3% | 10.4%(+15.9)#32 | 11.0%(+15.3)#1,304 |
| 33. | Siglerville | 26.1% | 10.4%(+15.7)#33 | 11.0%(+15.1)#1,325 |
| 34. | Mingoville | 26.1% | 10.4%(+15.7)#34 | 11.0%(+15.1)#1,332 |
| 35. | Bradford Woods Borough | 25.9% | 10.4%(+15.5)#35 | 11.0%(+14.9)#1,362 |
| 36. | Sheppton | 25.6% | 10.4%(+15.2)#36 | 11.0%(+14.6)#1,400 |
| 37. | Newtown Grant | 25.6% | 10.4%(+15.2)#37 | 11.0%(+14.6)#1,416 |
| 38. | Worthville Borough | 25.0% | 10.4%(+14.6)#38 | 11.0%(+14.0)#1,514 |
| 39. | Curryville | 25.0% | 10.4%(+14.6)#39 | 11.0%(+14.0)#1,523 |
| 40. | Churchtown | 24.9% | 10.4%(+14.4)#40 | 11.0%(+13.8)#1,545 |
| 41. | Pine Grove Mills | 24.6% | 10.4%(+14.1)#41 | 11.0%(+13.5)#1,592 |
| 42. | Woodward | 24.3% | 10.4%(+13.9)#42 | 11.0%(+13.3)#1,637 |
| 43. | Davidsville | 24.3% | 10.4%(+13.9)#43 | 11.0%(+13.3)#1,644 |
| 44. | Sturgeon | 24.3% | 10.4%(+13.9)#44 | 11.0%(+13.3)#1,648 |
| 45. | Schnecksville | 24.3% | 10.4%(+13.8)#45 | 11.0%(+13.2)#1,653 |
| 46. | Stonybrook | 23.9% | 10.4%(+13.5)#46 | 11.0%(+12.9)#1,723 |
| 47. | Buck Run | 23.9% | 10.4%(+13.5)#47 | 11.0%(+12.9)#1,734 |
| 48. | Shelocta Borough | 23.8% | 10.4%(+13.4)#48 | 11.0%(+12.8)#1,751 |
| 49. | Foxburg Borough | 23.7% | 10.4%(+13.3)#49 | 11.0%(+12.7)#1,759 |
| 50. | Blue Bell | 23.7% | 10.4%(+13.3)#50 | 11.0%(+12.7)#1,760 |
| 51. | Granville | 23.6% | 10.4%(+13.2)#51 | 11.0%(+12.6)#1,784 |
| 52. | Herminie | 23.4% | 10.4%(+12.9)#52 | 11.0%(+12.3)#1,836 |
| 53. | Crucible | 23.3% | 10.4%(+12.9)#53 | 11.0%(+12.3)#1,857 |
| 54. | Edgeworth Borough | 23.2% | 10.4%(+12.8)#54 | 11.0%(+12.2)#1,867 |
| 55. | Lima | 23.2% | 10.4%(+12.7)#55 | 11.0%(+12.1)#1,875 |
| 56. | Bell Acres Borough | 23.1% | 10.4%(+12.7)#56 | 11.0%(+12.1)#1,881 |
| 57. | Fox Chapel Borough | 23.1% | 10.4%(+12.7)#57 | 11.0%(+12.1)#1,886 |
| 58. | St Clairsville Borough | 23.1% | 10.4%(+12.7)#58 | 11.0%(+12.1)#1,907 |
| 59. | Mountainhome | 23.1% | 10.4%(+12.6)#59 | 11.0%(+12.0)#1,913 |
| 60. | Misericordia University | 22.9% | 10.4%(+12.5)#60 | 11.0%(+11.9)#1,937 |
| 61. | Eagleview | 22.8% | 10.4%(+12.4)#61 | 11.0%(+11.8)#1,965 |
| 62. | Chinchilla | 22.6% | 10.4%(+12.1)#62 | 11.0%(+11.5)#2,011 |
| 63. | Troxelville | 22.5% | 10.4%(+12.1)#63 | 11.0%(+11.5)#2,020 |
| 64. | Kimberton | 22.3% | 10.4%(+11.9)#64 | 11.0%(+11.3)#2,066 |
| 65. | Toughkenamon | 22.2% | 10.4%(+11.8)#65 | 11.0%(+11.2)#2,092 |
| 66. | Sewickley Hills Borough | 22.1% | 10.4%(+11.7)#66 | 11.0%(+11.1)#2,099 |
| 67. | Bakerstown | 21.9% | 10.4%(+11.5)#67 | 11.0%(+10.9)#2,155 |
| 68. | Beech Mountain Lakes | 21.9% | 10.4%(+11.5)#68 | 11.0%(+10.9)#2,160 |
| 69. | Woxall | 21.9% | 10.4%(+11.4)#69 | 11.0%(+10.8)#2,170 |
| 70. | Rupert | 21.8% | 10.4%(+11.4)#70 | 11.0%(+10.8)#2,193 |
| 71. | Mount Aetna | 21.7% | 10.4%(+11.3)#71 | 11.0%(+10.7)#2,209 |
| 72. | Lake Latonka | 21.7% | 10.4%(+11.3)#72 | 11.0%(+10.7)#2,214 |
| 73. | Sutersville Borough | 21.6% | 10.4%(+11.1)#73 | 11.0%(+10.5)#2,253 |
| 74. | Pen Mar | 21.5% | 10.4%(+11.0)#74 | 11.0%(+10.4)#2,267 |
| 75. | Waverly | 21.5% | 10.4%(+11.0)#75 | 11.0%(+10.4)#2,268 |
| 76. | Eastlawn Gardens | 21.3% | 10.4%(+10.9)#76 | 11.0%(+10.3)#2,310 |
| 77. | Seltzer | 21.3% | 10.4%(+10.9)#77 | 11.0%(+10.3)#2,319 |
| 78. | Bobtown | 21.3% | 10.4%(+10.9)#78 | 11.0%(+10.3)#2,341 |
| 79. | Sewickley Borough | 21.2% | 10.4%(+10.8)#79 | 11.0%(+10.2)#2,351 |
| 80. | Newtown Borough | 21.2% | 10.4%(+10.8)#80 | 11.0%(+10.2)#2,358 |
| 81. | Trexlertown | 21.0% | 10.4%(+10.6)#81 | 11.0%(+9.97)#2,426 |
| 82. | South Philipsburg | 21.0% | 10.4%(+10.6)#82 | 11.0%(+9.97)#2,427 |
| 83. | Witmer | 20.9% | 10.4%(+10.5)#83 | 11.0%(+9.93)#2,437 |
| 84. | Schoeneck | 20.9% | 10.4%(+10.5)#84 | 11.0%(+9.90)#2,447 |
| 85. | Hannasville | 20.9% | 10.4%(+10.5)#85 | 11.0%(+9.88)#2,454 |
| 86. | Greenfields | 20.8% | 10.4%(+10.4)#86 | 11.0%(+9.76)#2,493 |
| 87. | Sandy Ridge | 20.8% | 10.4%(+10.3)#87 | 11.0%(+9.73)#2,499 |
| 88. | Sylvan Hills | 20.7% | 10.4%(+10.3)#88 | 11.0%(+9.71)#2,507 |
| 89. | Smoketown | 20.7% | 10.4%(+10.3)#89 | 11.0%(+9.67)#2,518 |
| 90. | Penryn | 20.4% | 10.4%(+10.0)#90 | 11.0%(+9.41)#2,598 |
| 91. | Little Meadows Borough | 20.4% | 10.4%(+9.97)#91 | 11.0%(+9.37)#2,614 |
| 92. | West Conshohocken Borough | 20.3% | 10.4%(+9.88)#92 | 11.0%(+9.28)#2,638 |
| 93. | Riegelsville Borough | 20.3% | 10.4%(+9.88)#93 | 11.0%(+9.27)#2,641 |
| 94. | Church Hill | 20.3% | 10.4%(+9.84)#94 | 11.0%(+9.24)#2,658 |
| 95. | Heilwood | 20.2% | 10.4%(+9.77)#95 | 11.0%(+9.16)#2,679 |
| 96. | Fort Washington | 20.1% | 10.4%(+9.71)#96 | 11.0%(+9.11)#2,692 |
| 97. | Collinsburg | 20.1% | 10.4%(+9.66)#97 | 11.0%(+9.06)#2,710 |
| 98. | Laurel Mountain Borough | 20.0% | 10.4%(+9.58)#98 | 11.0%(+8.98)#2,758 |
| 99. | Rose Valley Borough | 19.9% | 10.4%(+9.51)#99 | 11.0%(+8.90)#2,794 |
| 100. | Mcmurray | 19.8% | 10.4%(+9.40)#100 | 11.0%(+8.80)#2,829 |
Common Questions
What are the Top 10 Cities with the Highest Percentage of Population Employed in Management in Pennsylvania?
Top 10 Cities with the Highest Percentage of Population Employed in Management in Pennsylvania are:
#1
100.0%
#2
47.8%
#3
47.6%
#4
43.0%
#5
40.5%
#6
40.1%
#7
39.0%
#8
36.2%
#9
29.8%
#10
29.2%
What city has the Highest Percentage of Population Employed in Management in Pennsylvania?
Westland has the Highest Percentage of Population Employed in Management in Pennsylvania with 100.0%.
What is the Percentage of Population Employed in Management in the State of Pennsylvania?
Percentage of Population Employed in Management in Pennsylvania is 10.4%.
What is the Percentage of Population Employed in Management in the United States?
Percentage of Population Employed in Management in the United States is 11.0%.