Cities with the Highest Percentage of Population Employed in Management in West Virginia
RELATED REPORTS & OPTIONS
Management
West Virginia
Compare Cities
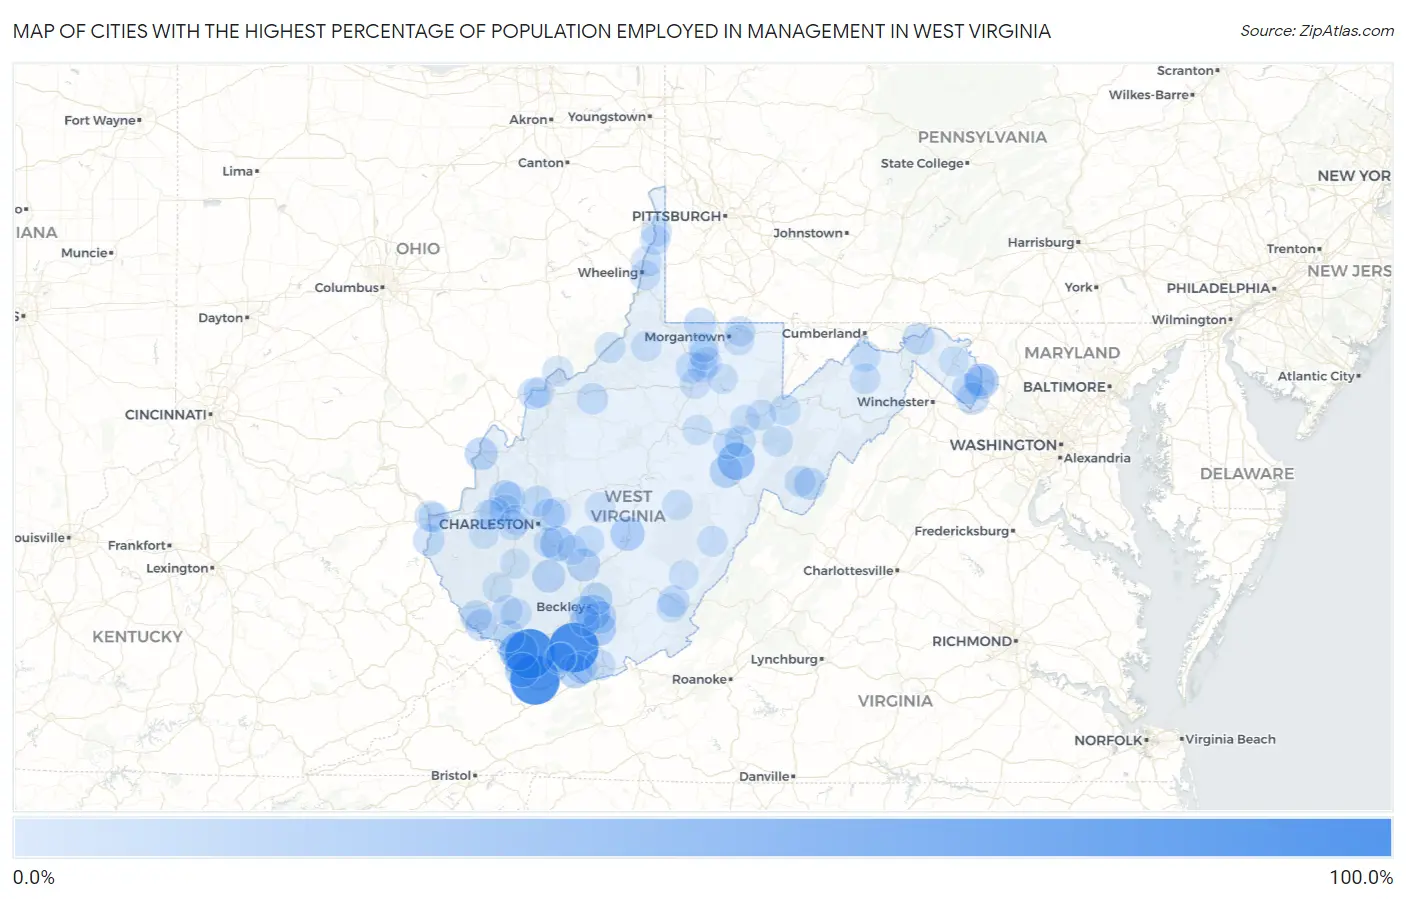
Map of Cities with the Highest Percentage of Population Employed in Management in West Virginia
0.0%
100.0%
Cities with the Highest Percentage of Population Employed in Management in West Virginia
| City | % Employed | vs State | vs National | |
| 1. | Cunard | 100.0% | 8.3%(+91.7)#1 | 11.0%(+89.0)#5 |
| 2. | Berwind | 100.0% | 8.3%(+91.7)#2 | 11.0%(+89.0)#7 |
| 3. | Roderfield | 100.0% | 8.3%(+91.7)#3 | 11.0%(+89.0)#12 |
| 4. | Covel | 100.0% | 8.3%(+91.7)#4 | 11.0%(+89.0)#13 |
| 5. | Iaeger | 47.1% | 8.3%(+38.9)#5 | 11.0%(+36.1)#294 |
| 6. | Malden | 41.8% | 8.3%(+33.5)#6 | 11.0%(+30.8)#393 |
| 7. | East Dailey | 41.3% | 8.3%(+33.0)#7 | 11.0%(+30.2)#407 |
| 8. | Harpers Ferry | 33.3% | 8.3%(+25.1)#8 | 11.0%(+22.3)#674 |
| 9. | Shrewsbury | 32.4% | 8.3%(+24.1)#9 | 11.0%(+21.4)#753 |
| 10. | Beaver | 32.0% | 8.3%(+23.7)#10 | 11.0%(+21.0)#773 |
| 11. | Newark | 31.5% | 8.3%(+23.2)#11 | 11.0%(+20.4)#800 |
| 12. | Raysal | 30.8% | 8.3%(+22.5)#12 | 11.0%(+19.7)#843 |
| 13. | Ghent | 29.0% | 8.3%(+20.7)#13 | 11.0%(+18.0)#985 |
| 14. | Bramwell | 28.3% | 8.3%(+20.0)#14 | 11.0%(+17.2)#1,057 |
| 15. | Summersville | 28.0% | 8.3%(+19.8)#15 | 11.0%(+17.0)#1,087 |
| 16. | Peach Creek | 23.8% | 8.3%(+15.6)#16 | 11.0%(+12.8)#1,752 |
| 17. | Huttonsville | 23.1% | 8.3%(+14.8)#17 | 11.0%(+12.1)#1,904 |
| 18. | Henderson | 22.9% | 8.3%(+14.7)#18 | 11.0%(+11.9)#1,931 |
| 19. | Whitesville | 22.5% | 8.3%(+14.2)#19 | 11.0%(+11.5)#2,025 |
| 20. | Beards Fork | 22.5% | 8.3%(+14.2)#20 | 11.0%(+11.5)#2,029 |
| 21. | Shady Spring | 21.9% | 8.3%(+13.7)#21 | 11.0%(+10.9)#2,150 |
| 22. | Big Chimney | 20.1% | 8.3%(+11.9)#22 | 11.0%(+9.09)#2,698 |
| 23. | Eleanor | 20.1% | 8.3%(+11.8)#23 | 11.0%(+9.05)#2,713 |
| 24. | Piney View | 20.0% | 8.3%(+11.7)#24 | 11.0%(+8.98)#2,726 |
| 25. | Shannondale | 19.5% | 8.3%(+11.2)#25 | 11.0%(+8.43)#2,956 |
| 26. | Brandywine | 18.7% | 8.3%(+10.4)#26 | 11.0%(+7.65)#3,275 |
| 27. | Great Cacapon | 18.5% | 8.3%(+10.2)#27 | 11.0%(+7.46)#3,360 |
| 28. | Montcalm | 18.3% | 8.3%(+10.0)#28 | 11.0%(+7.27)#3,479 |
| 29. | Red Jacket | 18.3% | 8.3%(+10.0)#29 | 11.0%(+7.26)#3,483 |
| 30. | Keystone | 18.2% | 8.3%(+9.93)#30 | 11.0%(+7.16)#3,543 |
| 31. | Blacksville | 17.9% | 8.3%(+9.61)#31 | 11.0%(+6.84)#3,707 |
| 32. | Delbarton | 17.4% | 8.3%(+9.20)#32 | 11.0%(+6.43)#3,923 |
| 33. | Gilbert Creek | 17.2% | 8.3%(+8.99)#33 | 11.0%(+6.22)#4,048 |
| 34. | Justice Addition | 17.2% | 8.3%(+8.99)#34 | 11.0%(+6.22)#4,058 |
| 35. | Dupont | 17.0% | 8.3%(+8.76)#35 | 11.0%(+5.99)#4,183 |
| 36. | Lewisburg | 16.9% | 8.3%(+8.68)#36 | 11.0%(+5.91)#4,220 |
| 37. | Washington | 16.6% | 8.3%(+8.33)#37 | 11.0%(+5.56)#4,460 |
| 38. | Prichard | 16.6% | 8.3%(+8.33)#38 | 11.0%(+5.56)#4,463 |
| 39. | Cairo | 16.0% | 8.3%(+7.75)#39 | 11.0%(+4.98)#4,810 |
| 40. | Enterprise | 15.6% | 8.3%(+7.37)#40 | 11.0%(+4.61)#5,118 |
| 41. | Belva | 15.4% | 8.3%(+7.13)#41 | 11.0%(+4.36)#5,332 |
| 42. | Sissonville | 15.3% | 8.3%(+7.07)#42 | 11.0%(+4.30)#5,383 |
| 43. | Kenova | 15.1% | 8.3%(+6.82)#43 | 11.0%(+4.05)#5,583 |
| 44. | Womelsdorf Coalton | 14.8% | 8.3%(+6.50)#44 | 11.0%(+3.73)#5,838 |
| 45. | Davis | 14.7% | 8.3%(+6.41)#45 | 11.0%(+3.64)#5,906 |
| 46. | Elkins | 14.6% | 8.3%(+6.38)#46 | 11.0%(+3.61)#5,935 |
| 47. | Crab Orchard | 14.6% | 8.3%(+6.31)#47 | 11.0%(+3.54)#5,991 |
| 48. | Winfield | 14.4% | 8.3%(+6.17)#48 | 11.0%(+3.40)#6,119 |
| 49. | Charles Town | 14.4% | 8.3%(+6.14)#49 | 11.0%(+3.37)#6,146 |
| 50. | Franklin | 14.3% | 8.3%(+6.03)#50 | 11.0%(+3.27)#6,240 |
| 51. | Teays Valley | 14.2% | 8.3%(+5.94)#51 | 11.0%(+3.18)#6,357 |
| 52. | Follansbee | 14.0% | 8.3%(+5.71)#52 | 11.0%(+2.94)#6,569 |
| 53. | Fort Ashby | 13.8% | 8.3%(+5.52)#53 | 11.0%(+2.75)#6,749 |
| 54. | Clearview | 13.7% | 8.3%(+5.42)#54 | 11.0%(+2.65)#6,849 |
| 55. | Mallory | 13.7% | 8.3%(+5.41)#55 | 11.0%(+2.64)#6,855 |
| 56. | Hurricane | 13.5% | 8.3%(+5.24)#56 | 11.0%(+2.47)#7,048 |
| 57. | Tornado | 13.5% | 8.3%(+5.23)#57 | 11.0%(+2.46)#7,058 |
| 58. | Kanawha | 13.4% | 8.3%(+5.18)#58 | 11.0%(+2.41)#7,110 |
| 59. | Hinkleville | 13.3% | 8.3%(+5.01)#59 | 11.0%(+2.24)#7,306 |
| 60. | Princeton | 13.1% | 8.3%(+4.86)#60 | 11.0%(+2.09)#7,434 |
| 61. | Williamstown | 13.0% | 8.3%(+4.73)#61 | 11.0%(+1.96)#7,592 |
| 62. | Romney | 12.8% | 8.3%(+4.55)#62 | 11.0%(+1.79)#7,796 |
| 63. | Brookhaven | 12.7% | 8.3%(+4.42)#63 | 11.0%(+1.65)#7,947 |
| 64. | Pleasant Valley | 12.6% | 8.3%(+4.37)#64 | 11.0%(+1.60)#7,994 |
| 65. | Sistersville | 12.5% | 8.3%(+4.28)#65 | 11.0%(+1.51)#8,102 |
| 66. | Harman | 12.5% | 8.3%(+4.25)#66 | 11.0%(+1.48)#8,182 |
| 67. | Marlinton | 12.4% | 8.3%(+4.15)#67 | 11.0%(+1.38)#8,294 |
| 68. | Parsons | 12.4% | 8.3%(+4.14)#68 | 11.0%(+1.37)#8,310 |
| 69. | Ceredo | 12.2% | 8.3%(+3.96)#69 | 11.0%(+1.19)#8,539 |
| 70. | Chesapeake | 12.2% | 8.3%(+3.93)#70 | 11.0%(+1.17)#8,582 |
| 71. | St Albans | 12.2% | 8.3%(+3.92)#71 | 11.0%(+1.15)#8,597 |
| 72. | Addison Webster Springs | 12.1% | 8.3%(+3.85)#72 | 11.0%(+1.08)#8,698 |
| 73. | Bridgeport | 12.1% | 8.3%(+3.83)#73 | 11.0%(+1.06)#8,721 |
| 74. | Booth | 11.6% | 8.3%(+3.33)#74 | 11.0%(+0.559)#9,439 |
| 75. | Greenville | 11.6% | 8.3%(+3.32)#75 | 11.0%(+0.550)#9,450 |
| 76. | Clay | 11.5% | 8.3%(+3.29)#76 | 11.0%(+0.519)#9,494 |
| 77. | Pine Grove | 11.4% | 8.3%(+3.14)#77 | 11.0%(+0.373)#9,716 |
| 78. | Wellsburg | 11.3% | 8.3%(+3.10)#78 | 11.0%(+0.328)#9,789 |
| 79. | Cheat Lake | 11.3% | 8.3%(+3.04)#79 | 11.0%(+0.275)#9,878 |
| 80. | White Hall | 11.3% | 8.3%(+3.01)#80 | 11.0%(+0.242)#9,922 |
| 81. | Buckhannon | 11.2% | 8.3%(+2.96)#81 | 11.0%(+0.192)#10,004 |
| 82. | Man | 11.2% | 8.3%(+2.92)#82 | 11.0%(+0.153)#10,053 |
| 83. | Coal City | 11.2% | 8.3%(+2.92)#83 | 11.0%(+0.150)#10,056 |
| 84. | Bethlehem | 11.2% | 8.3%(+2.91)#84 | 11.0%(+0.144)#10,063 |
| 85. | Blennerhassett | 11.1% | 8.3%(+2.87)#85 | 11.0%(+0.099)#10,128 |
| 86. | Culloden | 11.1% | 8.3%(+2.84)#86 | 11.0%(+0.072)#10,202 |
| 87. | Grafton | 10.8% | 8.3%(+2.59)#87 | 11.0%(-0.176)#10,561 |
| 88. | Barrackville | 10.8% | 8.3%(+2.59)#88 | 11.0%(-0.181)#10,565 |
| 89. | Martinsburg | 10.8% | 8.3%(+2.57)#89 | 11.0%(-0.200)#10,586 |
| 90. | Bolivar | 10.8% | 8.3%(+2.51)#90 | 11.0%(-0.255)#10,680 |
| 91. | Fairlea | 10.7% | 8.3%(+2.46)#91 | 11.0%(-0.313)#10,767 |
| 92. | Mitchell Heights | 10.5% | 8.3%(+2.22)#92 | 11.0%(-0.549)#11,153 |
| 93. | Danville | 10.4% | 8.3%(+2.19)#93 | 11.0%(-0.580)#11,210 |
| 94. | Northfork | 10.4% | 8.3%(+2.18)#94 | 11.0%(-0.585)#11,217 |
| 95. | Hamlin | 10.4% | 8.3%(+2.16)#95 | 11.0%(-0.612)#11,264 |
| 96. | Grant Town | 10.3% | 8.3%(+2.04)#96 | 11.0%(-0.726)#11,468 |
| 97. | Montrose | 10.2% | 8.3%(+1.92)#97 | 11.0%(-0.850)#11,659 |
| 98. | Montgomery | 10.1% | 8.3%(+1.88)#98 | 11.0%(-0.889)#11,718 |
| 99. | Elkview | 10.1% | 8.3%(+1.85)#99 | 11.0%(-0.916)#11,770 |
| 100. | Falling Spring | 10.0% | 8.3%(+1.75)#100 | 11.0%(-1.02)#11,969 |
Common Questions
What are the Top 10 Cities with the Highest Percentage of Population Employed in Management in West Virginia?
Top 10 Cities with the Highest Percentage of Population Employed in Management in West Virginia are:
#1
100.0%
#2
100.0%
#3
100.0%
#4
47.1%
#5
41.3%
#6
33.3%
#7
32.4%
#8
32.0%
#9
30.8%
#10
29.0%
What city has the Highest Percentage of Population Employed in Management in West Virginia?
Berwind has the Highest Percentage of Population Employed in Management in West Virginia with 100.0%.
What is the Percentage of Population Employed in Management in the State of West Virginia?
Percentage of Population Employed in Management in West Virginia is 8.3%.
What is the Percentage of Population Employed in Management in the United States?
Percentage of Population Employed in Management in the United States is 11.0%.